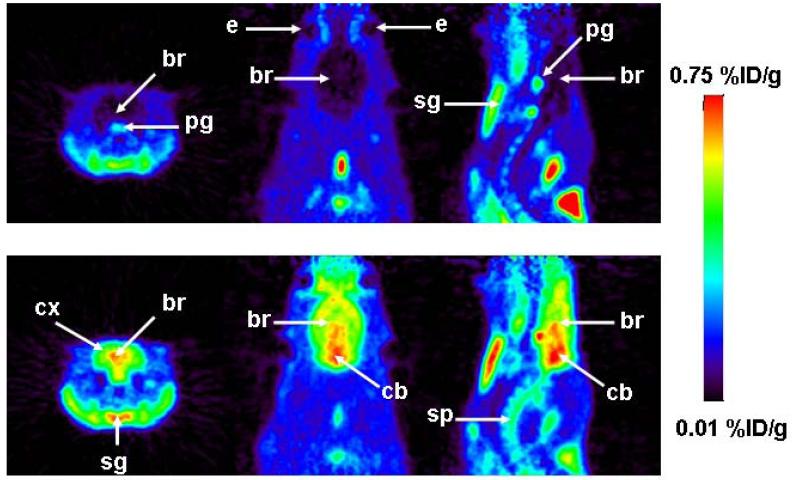
Figure 3.
Coronal (left), horizontal (center) and sagittal (right) PET summation images depicting the distribution of radioactivity following i.v. injection of [11C]-1 in a rat before (scan 1: 0-60 min, upper row) and after (scan 2: 0-60 min, lower row) administration of unlabeled 1 (5 mg/kg). Activity concentration is expressed as %ID/g. The radiation scale is set from 0.01 to 0.75 %ID/g; dark colors indicate low and bright colors indicate high activity concentrations. Anatomical structures are indicated by arrows (br, brain; cx, cortex; cb, cerebellum; e, eye; sg, submandibular gland; pg, pituitary gland; sp, spine).

