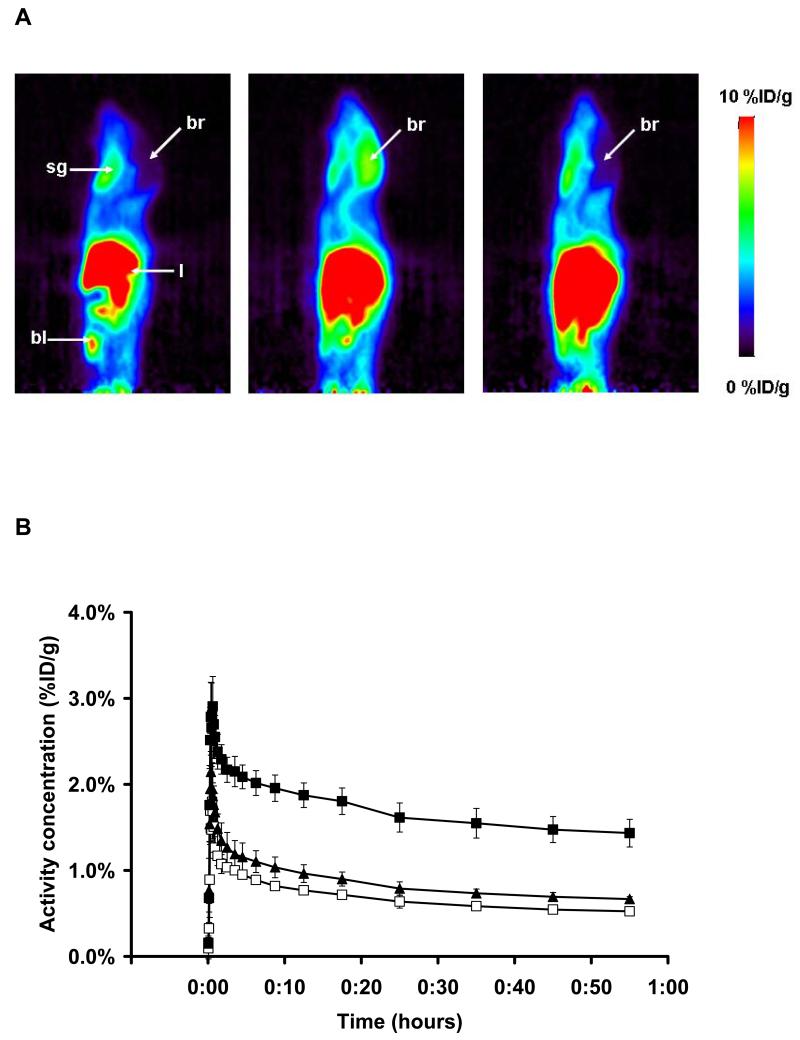
Figure 5.
A: Sagittal PET summation images (0-60 min) depicting the distribution of radioactivity following i.v. injection of [11C]-1 into a wild-type mouse (left), a Mdr1a/b(−/−) mouse (center) and a Bcrp1(−/−) mouse (right). Activity concentration is expressed as %ID/g and the radiation scale is set from 0 to 10 %ID/g. Anatomical structures are indicated by arrows (br, brain; bl, bladder; l, liver; sg, submandibular gland). B: TACs (mean %ID/g±SD) of [11C]-1 in whole brain of wild-type (open squares, n=3), Mdr1a/b(−/−) (closed squares, n=3) and Bcrp1(−/−) (closed triangles, n=3) mice.

