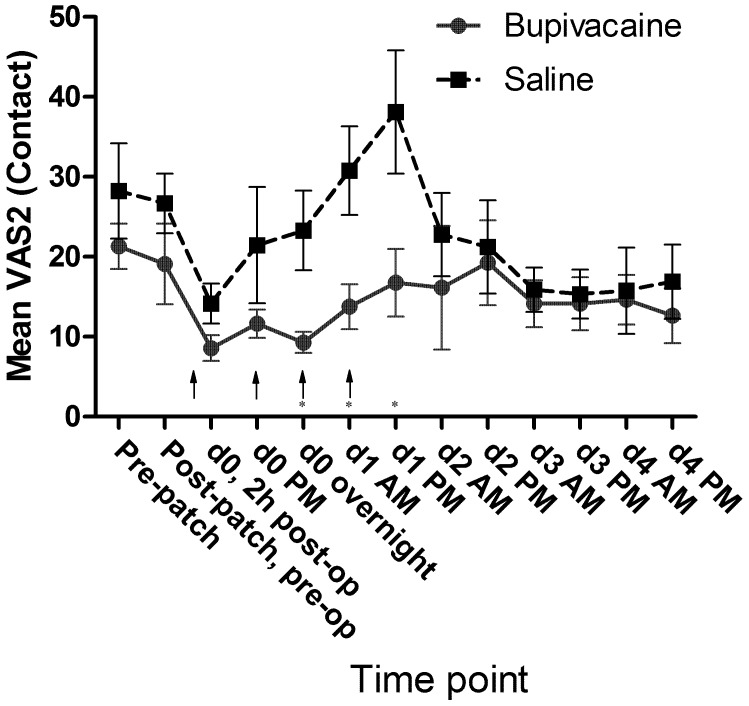
Figure 10.
Mean VAS2 (contact) scores by treatment group. Arrows indicate doses of local anesthetic or saline (control). Significant difference (Student t test) between groups on a particular day is indicated by an asterisk. d0, day of surgery; d1, first day after surgery; and so forth. Error bar, ±1 SEM.

