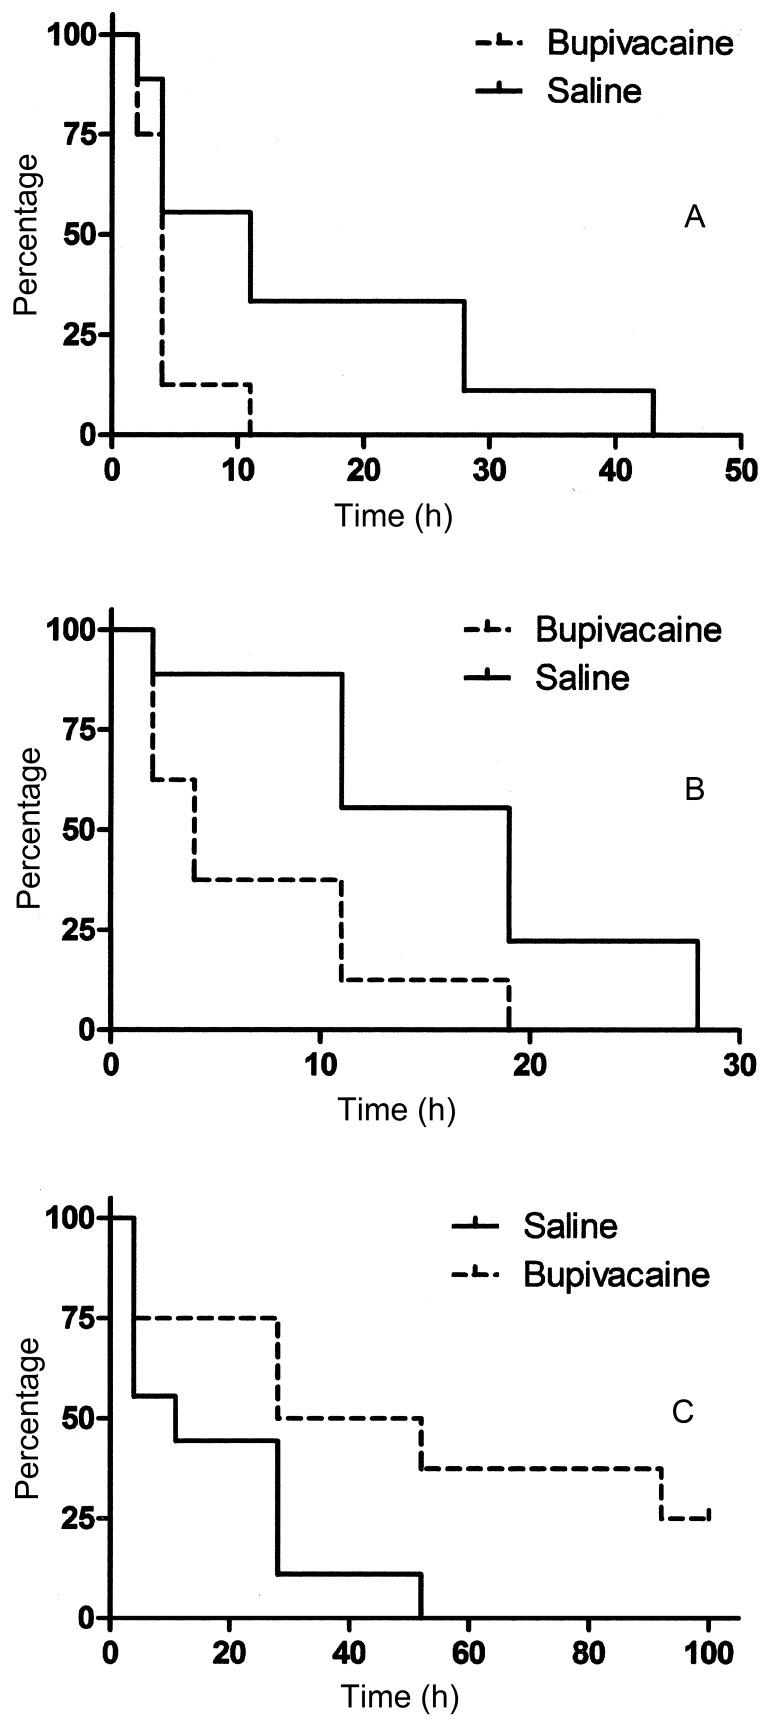
Figure 5.
Kaplan–Meier cumulative survival curves, showing the time (in h) to occurrence of the event of interest. (A) Time to first consumption of feed after surgery. Hazard ratio (95% confidence interval): 4.4 (1.0–18.7). The curves differ significantly (P = 0.048). (B) Time to first bowel movement after surgery. Hazard ratio (95% confidence interval): 5.0 (1.3–19.6). The curves differ significantly (P = 0.021). (C) Time to first administration of rescue analgesia after surgery. Hazard ratio (95% confidence interval): 3.9 (1.0–14.7). The survival curves differ significantly (P = 0.044).

