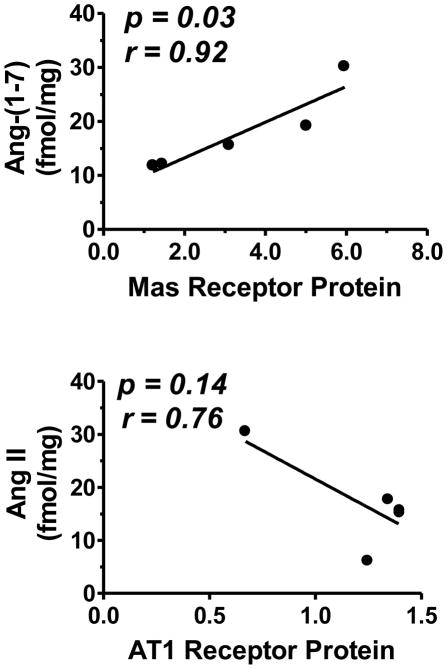
Figure 6.
Correlation of Mas protein expression with Ang-(1-7) peptide levels in the brain dorsal medulla. Control and betamethasone exposed (BMX) animals are both used in this correlation. There was a positive correlation between Mas receptor and Ang-(1-7) peptide concentration (upper panel), and a trend for negative correlation between AT1 receptor and Ang II peptide concentration (lower panel). Correlation analysis was performed using GraphPad Prism 5.01 plotting and statistical software. Data are mean ± SEM [N = 5 in each group of control and BMX sheep].

