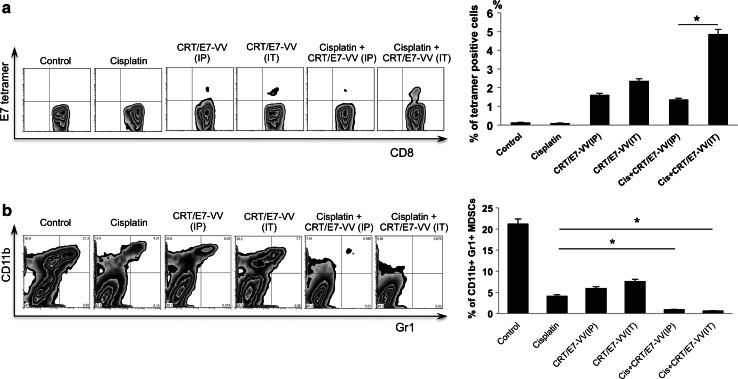
Fig. 3.
Characterization of E7-specific CD8+ T cells and myeloid-derived suppressor cells following various treatments. Peripheral blood samples (collected from the tail vein on day 10 after last treatment) were stained with PE-conjugated HPV16 H-2Db–RAHYNIVTF (E7) tetramer reagent and FITC-conjugated CD8+ antibody. a Left panel is representative flow cytometry analysis. Right panel is bar graph representing the percentage of E7-specific CD8+ T cells among all CD8+ T cells of peripheral blood. b Splenocytes were harvested on day 34 after tumor challenge. The cells isolated from spleens were then characterized for the presence of CD11b+ Gr1+ myeloid suppressor cells using flow cytometry analysis. Left panel is representative flow cytometry analysis. Right panel is a bar graph depicting the percentages of CD11b+ Gr1+ myeloid suppressor cells per 3 × 10⁵ monocytes in the spleen. Data shown are representative of two experiments conducted. Columns, mean; bars, SE (*p < 0.05)

