Fig. 4.
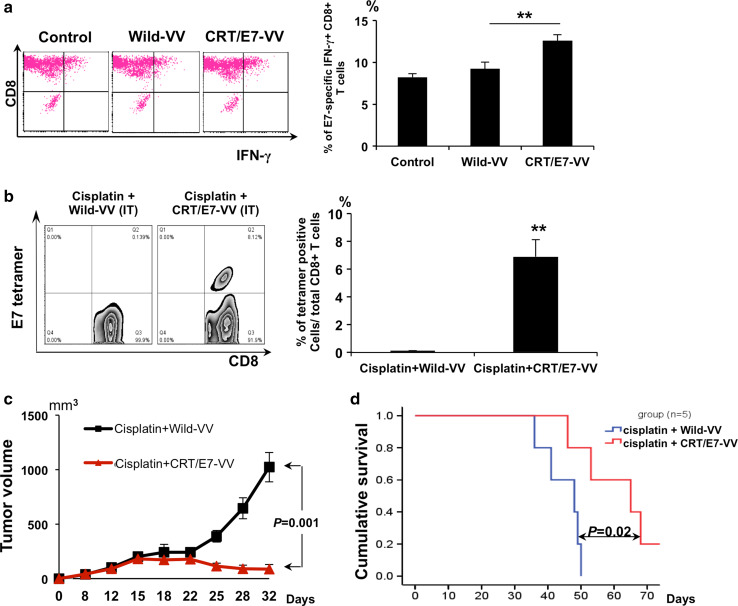
Characterization of TC-1 tumor cells following infection with various vaccinia viruses. a Intracellular cytokine staining and flow cytometry analysis to determine the number of IFN-γ–secreting E7-specific CD8+ T cells induced by non-infected TC-1 cells or wild type vaccinia virus–infected TC-1 cells or CRT/E7-VV-infected TC-1 cells (MOI = 0.5). TC-1 cells were incubated with cells from an E7-specific CD8+ T-cell line at 1:1 E:T ratio for 15 h. After incubation, cells were stained for CD8 and IFN-γ and analyzed by flow cytometry. Left panel is representative flow cytometry analysis. Right panel is a bar graph representing the percentage of IFN-γ secreting E7-specific CD8+ T cells among all CD8+ T cells. Data shown are mean of three experiments performed (**p < 0.01). b Peripheral blood samples (collected from the tail vein on day 10 after last treatment) were stained with PE-conjugated HPV16 E7 tetramer reagent and FITC-conjugated CD8+ cells. Left panel is representative flow cytometry analysis. Right panel is a bar graph representing the percentage of E7-specific CD8+ T cells among all CD8+ T cells of peripheral blood. Data shown are representative of two experiments performed. Columns, mean; bars, SE (*p < 0.05, **p < 0.01).c Groups of C57BL/6 mice (five per group) were s.c. challenged with 1 × 10⁵ TC-1 tumor cells per mouse on day 0. Tumor-bearing mice were treated with cisplatin and wild type vaccinia virus or CRT/E7-VV according to the schedule in Fig. 1a. The line graph depicting the tumor volume in TC-1 tumor-bearing mice treated with cisplatin with wild type VV or CRT/E7-VV (mean ± SE) (p = 0.001). d Kaplan–Meier survival analysis of TC-1 tumor-bearing mice treated with the different treatment regimens

