
Figure 4.
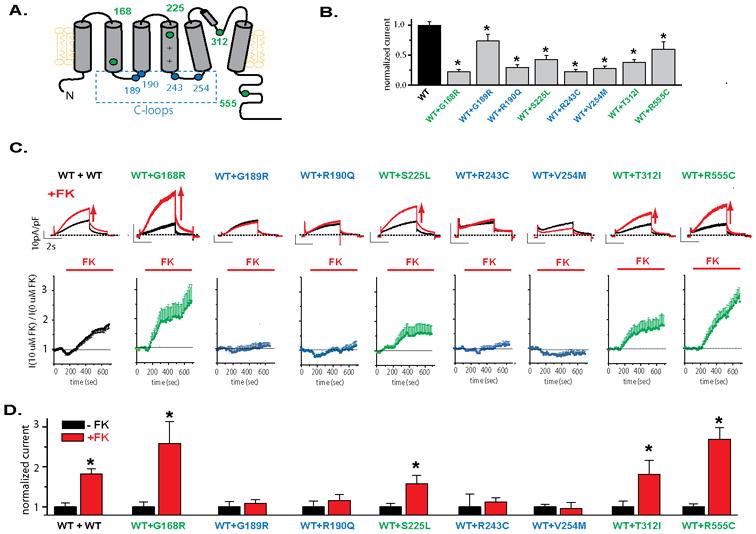
Regulation of LQT1 mutant channels by PKA. A. Schematic representation of location of the mutations used in the study. B: Effect of each of the mutations studied in basal non stimulated cell currents. Average current measured for cells expressing WT and mutant subunits measured at +40 mV after 3sec depolarization. KCNQ1 and KCNE1 subunit were expressed at a ratio 0.5 KCNQ1WT: 0.5 KCNQ1mut : 1 KCNE1 or 0.5 KCNQ1WT : 0.5vector : 1 KCNE1 for wild-type haploinsuficient channels, *p<0.05 compared to WT. C: Top panel: typical ion channel current measured before and after 10 min application of the PKA activator forskolin (FK, 10 μM) for wild-type (WT) and WT and mutant subunits co-expressed. Scale bars in each panel are 10pA/pF and 2sec. Scale bars are the same for all constructs. Bottom panel: time course of current regulation by forskolin measured at +20 mV after 3sec depolarization for channels formed by either WT or mutant co-expressed with WT subunits, as indicated. Current was normalized to current in the absence of forskolin application. KCNQ1 and KCNE1 subunits were expressed at a ratio 0.5 KCNQ1WT : 0.5 KCNQ1mut : 1 KCNE1 or 1 KCNQ1WT : 1 KCNE1 for wild-type channels. Currents were activated by 4sec depolarizing steps to +20 mV from a -80mV holding potential. These were followed by a step to −20mV. D: Summary data for experiments done as in C, *p<0.05 compared to the current before stimulation (black bar) in each group.