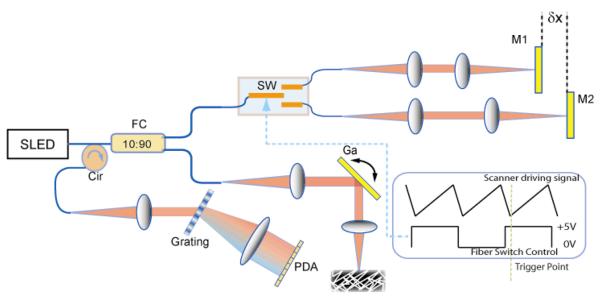
Fig.1.

Measurement setup with a spectral-domain optical coherence tomography. Two reference arms with mirrors (M1 and M2) were separated by a distance of δ× and alternately accessed by a high speed fiber switch (SW). FC: fiber coupler; Cir: fiber circulator; Ga: galvanometer; PDA: InGaAs photodetector linear array; SLED: superluminescent diode;
