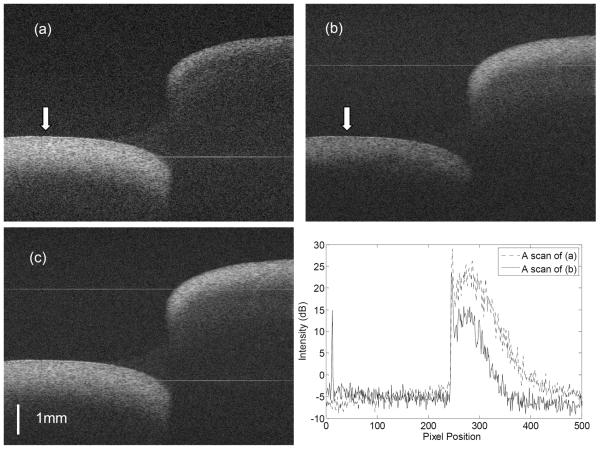
Fig. 4.
Images of dog endocrinal tissue ex vivo. (a) and (b) are the images recorded alternately with the two separated reference arms (M1 and M2) . The image size is 1000 pixels (width) × 677 pixels (height). The faint horizontal lines shown in the images are the residual DC lines. (c) is the fused image resulting from (a) and (b). (d) Average of 40 neighboring A-scans at the location marked by the arrows in (a) and (b) demonstrating the advantage of the range extension.

