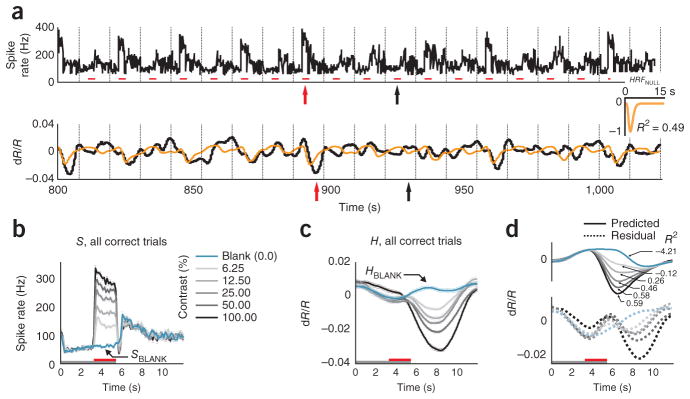
Figure 1.

The full hemodynamic signal is poorly predicted by local multi-unit spiking. (a) Top, a section of the full recorded spiking signal (S) for a representative experimental session (black trace). Bottom, corresponding measured hemodynamic signal (H, black) and the best prediction obtained from spiking (orange, , ⊗ indicates convolution; Supplementary Note, equation (3)). Inset, best fitting kernel HRFNULL (amplitude normalized) obtained by fitting H to S. Mean R2 = 0.49, as calculated using mean signals averaged across contrasts (n = 261 trials total, roughly 43 per contrast). Red line segments indicate stimulus application and vertical dotted lines indicate fixation trial onset. Red and black arrows below traces indicate typical responses to high-contrast (100% contrast) and blank (0% contrast) stimuli, respectively; for hemodynamics, increasing negative amplitudes, that is, increasing absorption of light by cortex, equals increasing blood volume. Note the poor match between the observed and predicted traces leading to a large residual and, consequently, low mean R2. (b) Trial-aligned averages of spiking (S) for each contrast. The trial structure is indicated by the color bars (gray, fixate; red, stimulus; no bar, relax). Note the prominent blank-trial spiking signal SBLANK. (c) Data presented as in b for hemodynamics (H). (d) Data are presented as in b for corresponding predicted hemodynamics (solid lines, top) and residuals ( , dotted lines, bottom; separated vertically for visibility). Individual R2, calculated separately per contrast, are shown alongside each prediction. Data were obtained from monkey S. Error bars represent s.e.m.
