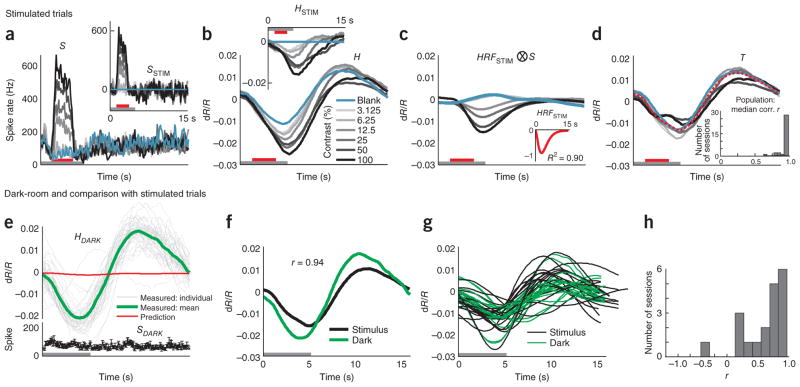
Figure 4.
Estimated trial-related signal T is consistent across contrasts, across experiments, and between stimulated and dark-room trials. (a, b) Spiking (a) and hemodynamics (b) from another representative session. Insets, corresponding SSTIM and HSTIM. The trial structure is indicated by the color bars (gray, fixate; red, stimulus; no bar, relax). (c) Prediction convolving optimal kernel HRFSTIM (inset) with full spiking S (that is, HRFSTIM ⊗S). (d) Estimated trial-related signals (T =〈H −HRFSTIM ⊗ S〉; Supplementary Note, equation (9)) shown individually by contrast; red indicates mean across contrasts. Note the high amplitude of mean T (s.d. = 0.0088, compared with 0.0058 for HSTIM using 100% contrast; a 1.5-fold difference). Note the marked similarity of signals T across contrasts (correlation (Pearson’s r) with leave-one-out means: 0.99, 0.99, 0.99, 0.99, 0.99, 0.99 and 0.96 for contrasts 0–100% in sequence; n = 175 trials, 25 per contrast, 7 contrasts, median r = 0.99). Inset, population histogram of median r (mean (s.e.m.) = 0.94 (0.01), n = 34). (e) Dark-room trials for the sessions shown in a–d. Top, hemodynamic traces, HDARK. Gray lines are individual traces, all correct trials (n = 45), the green line is the mean of correct trials, and the red line is the prediction, convolving HRFSTIM with dark-room spiking SDARK (bottom trace, black). Trial structure indicated on time axis (periodic fixations in darkness). (f) Mean trial-related signals T from stimulus-driven (black) and dark-room trials (green), same session (Pearson’s r = 0.94). (g) Signals T as in f for full population (n = 19 pairs, monkey T). (h) Pairwise correlations between stimulated and corresponding dark-room T over population (mean (s.e.m.), pairwise Pearson’s r = 0.61 (0.08), n = 19 pairs).

