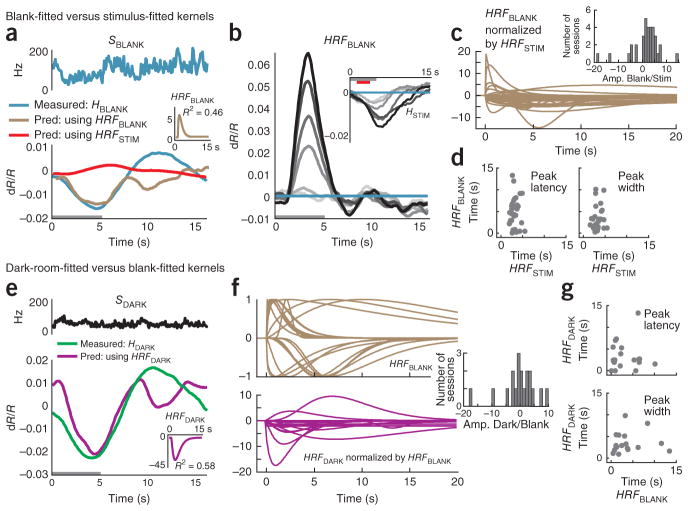
Figure 6.
Blank-trial and dark-room hemodynamic responses are poorly fitted to spiking. (a) Blank-trial responses (same experiment as shown in Fig. 4). Top, SBLANK. Bottom, corresponding HBLANK comparing the measured value (blue) with two alternative predictions: one from SBLANK using session’s stimulus-fitted kernel (red, HRFSTIM ⊗SBLANK, R2= −0.19, n = 25 trials) and the other using the optimal blank-fitted kernel (brown, HRFBLANK ⊗SBLANK, R2 = 0.46). Inset, the blank-fitted kernel HRFBLANK (amplitude normalized to HRFSTIM). Gray bar indicates fixation. (b) Predictions (HRFBLANK ⊗SSTIM) of stimulus-evoked hemodynamics using blank-fitted kernel. Compare with measured HSTIM (inset) (mean R2 = −11.9). (c) Population of HRFBLANK kernels, each normalized by amplitude of corresponding HRFSTIM kernel. Inset, histogram of HRFBLANK amplitudes normalized by corresponding HRFSTIM (Amp. Blank/Stim., n = 34). (d) Peak latencies (left) and widths (right) of HRFBLANK versus HRFSTIM. Note the high variability (s.e.m.) in both parameters for the HRFBLANK. Population average latency (s.e.m): blank, 4.6 (0.6) s; stimulus, 3.1 (0.2) s; population average width (s.e.m.): blank, 5.8 (1.0) s; stimulus, 3.3 (0.2) s; n = 33; ignoring one outlier with width = 1.25 × 10⁸ s for the blank). (e) Data are presented as in a for the dark-room task (data from Fig. 4e). Top, SDARK. Bottom, corresponding HDARK comparing measured trace (green) with prediction using the optimal dark-fitted kernel (magenta, HRFDARK ⊗SDARK, R2 = 0.58). Inset, dark-fitted kernel HRFDARK (amplitude normalized to HRFSTIM). (f) Top, HRFBLANK kernels normalized by absolute values of their own amplitudes (note variability in time courses). Bottom, HRFDARK kernels normalized by corresponding HRFBLANK amplitudes. Inset, histogram of HRFDARK amplitudes normalized by HRFBLANK (Amp. Dark/Stim., n = 19 sessions). (g) Scatter plots of peak latencies (top, Pearson’s r = 0.04) and widths (bottom, r =0.07) comparing HRFDARK and corresponding HRFBLANK (n = 18; outlier ignored as in d).

