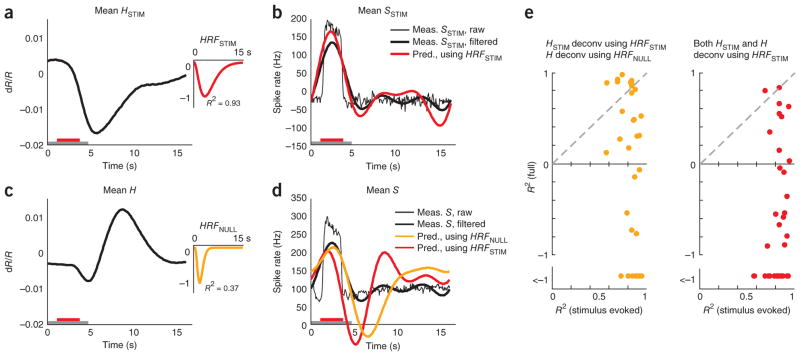
Figure 7.
Blank-subtracted, but not full, hemodynamic signal is a good proxy for local spiking responses. (a) Mean stimulus-evoked (that is, blank subtracted) hemodynamic response HSTIM averaged across contrasts for one experimental session. Inset, corresponding HRFSTIM (n = 162 trials, roughly 41 per contrast, mean R2 = 0.93). The trial structure is indicated by the color bars (gray, fixate; red, stimulus; no bar, relax). (b) Mean stimulus-evoked spiking. Thin black line, mean stimulus-evoked (blank subtracted) measured spiking SSTIM. Thick black line, low pass–filtered mean stimulus-evoked spiking SSTIM. Red, spiking estimated by deconvolving HSTIM with HRFSTIM. Note the good match with measured SSTIM (R2 = 0.82 with low pass–filtered SSTIM, R2 = 0.64 without low-pass filtering). (c) Mean full hemodynamics H: same data as in a, but without blank subtraction. Inset, corresponding HRFNULL. Note the poor mean R2 = 0.37 compared with HRFSTIM. (d) Mean full spiking without blank subtraction. Thin black line, mean measured spiking S. Thick black line, low pass–filtered mean measured spiking S. Orange, spiking estimated by deconvolving H with HRFNULL (R2 = −0.53). Red, spiking estimated by deconvolving H with HRFSTIM (R2 = −1.18; session mean spike rate added to deconvolved signals to align with measured spikes on vertical axis). Note the poor match of either estimate with measured full (low pass–filtered) spiking S. (e) Comparing R2 for estimates of spiking from full and stimulus-evoked hemodynamic signals over the population. Orange, HSTIM deconvolved with HRFSTIM and H deconvolved with HRFNULL. Red, both HSTIM and H deconvolved using HRFSTIM. Note the uniformly high R2 for estimating SSTIM from HSTIM (mean R2 (s.e.m.) = 0.85 (0.02), n = 34) versus low R2, including many large negative values for estimating S from full H (using HRFSTIM, mean R2 = −2.5 (0.9); using HRFNULL, mean R2 = −2.5 (1.0); n = 34).

