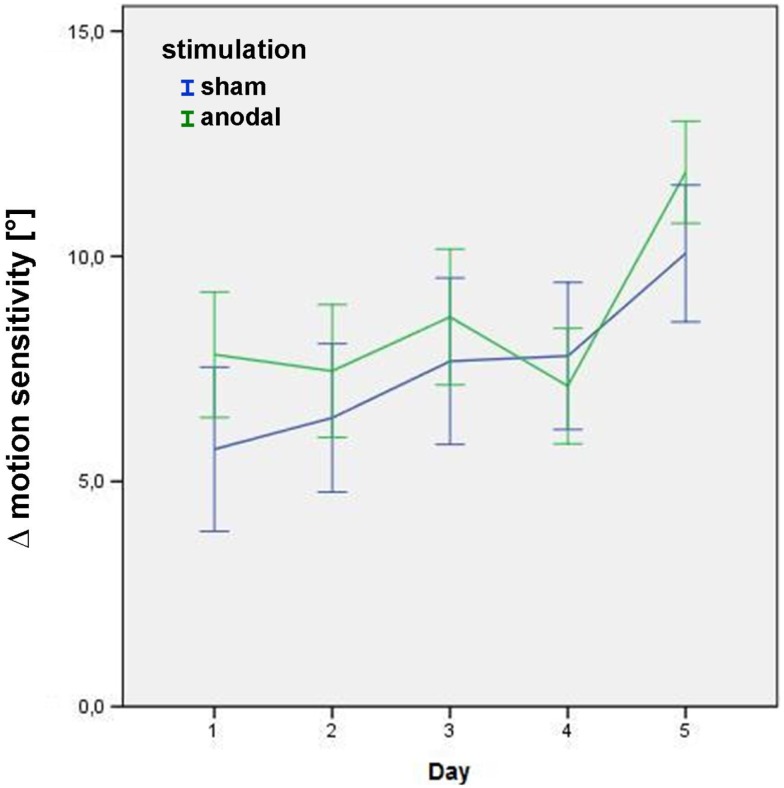
Figure 3.
Δ motion sensitivity during the stimulation week. Data from the post-stimulation motion detection tests on days 1–5 in the study block, showing improvement in age-matched motion detection [subtraction of the subjects’ motion threshold from decade-sensitive normal reference values data = Δ motion sensitivity (in°)] in both the sham (blue) and anodal (green) conditions. Error bars display one standard error of the mean. There was no significant baseline difference between groups (p = 0.266). See text for details of the significant main effects stimulation, day, and quadrant within the linear mixed model.

