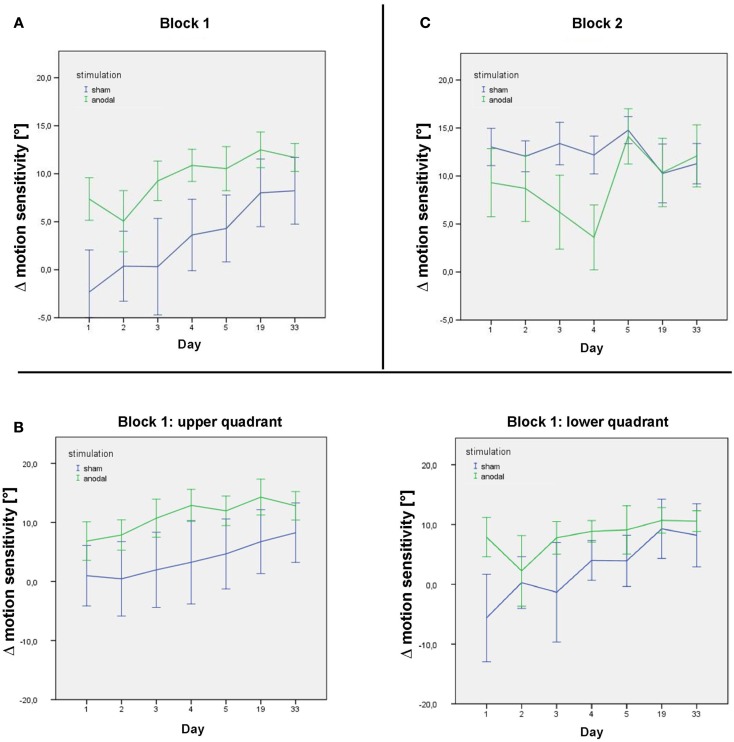
Figure 4.
Δ motion sensitivity during the stimulation week and follow-up. (A) Data from the post-stimulation motion detection tests on days 1–33 in the first study block, showing improvement in age-matched motion detection [subtraction of the subjects’ motion threshold from decade-sensitive normal reference values data = Δ motion sensitivity (in°)] in both the sham (blue) and anodal (green) conditions during the stimulation week and follow-up. (B) Data from the post-stimulation motion detection tests on days 1–33 in the first study block for the upper and lower quadrant separately. (C) Data from the post-stimulation motion detection tests on days 1–33 in the second study block, showing maintenance of motion detection level in the sham condition (blue) over the intervention week (following anodal stimulation in block 1) and improvement in motion detection in the anodal condition (green) over the intervention week (following sham stimulation in block 1). Follow-up sessions show a similar decrease in motion detection in both groups. Error bars display one standard error of the mean.

