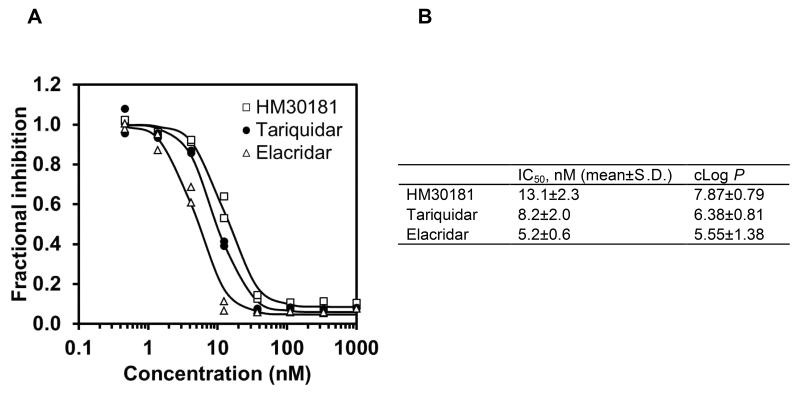
Fig. 2.
(A) Representative log concentration-response curves for inhibition of Pgp-mediated efflux transport of rhodamine 123 from CCRF-CEM T lymphoblast cells for HM30181, tariquidar and elacridar (1-100 nM). Response is expressed as fractional inhibition relative to experiment without inhibitor. All experiments were performed in duplicate and the same cell batch was used for assessment of all three inhibitors. Nonlinear regression analysis based on a log-sigmoidal model with fixed slope (Hill slope: -2) was performed using Prism 5.0 software. (B) Mean (±S.D.) half-maximum inhibitory concentrations (IC50, nM) of HM30181, tariquidar and elacridar in the rhodamine 123 efflux inhibition assay from at least 3 independent experiments performed each in duplicate and calculated log P values (P = octanol-to-water partition coefficient) using ACD/Labs ChemSketch 12.01 (Toronto, Canada).

