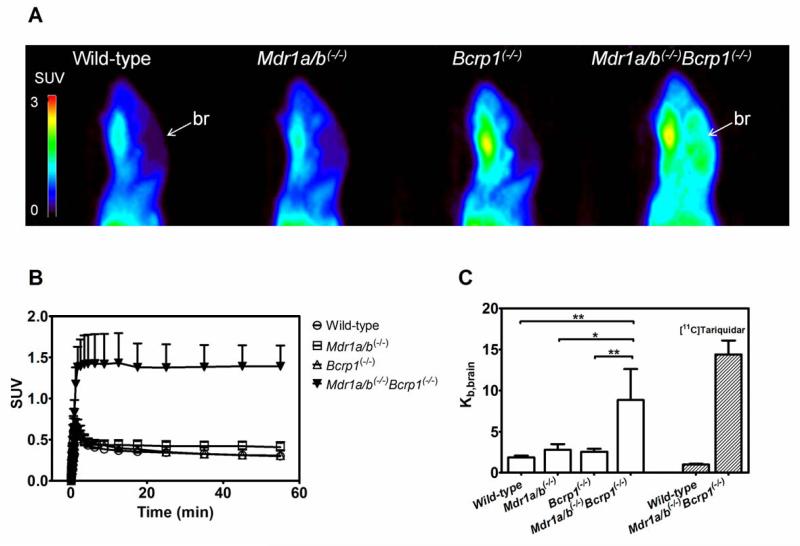
Fig. 4.
Sagittal PET summation images (0-60 min) (A) and mean (+S.D.) brain time-activity curves (B) of [11C]HM30181 in FVB wild-type, Mdr1a/b(−/−), Bcrp1(−/−) and Mdr1a/b(−/−)Bcrp1(−/−) mice (n = 4 per group except for Mdr1a/b(−/−) where n = 3). All images are set to the same intensity scale (0-3 SUV). The localisation of the brain (br) is indicated by a white arrow. In (C) mean (+S.D.) brain-to-blood radioactivity concentration ratios at the end of the PET scan (Kb,brain) are shown (*, P<0.05, **, P<0.01, 1-way ANOVA followed by Bonferroni’s multiple comparison test). For comparison, Kb,brain of [11C]tariquidar in FVB wild-type mice and in Mdr1a/b(−/−)Bcrp1(−/−) is also shown (Bauer et al., 2010).

