
Figure 2. Expression of anti-CEA scFv in VNP20009 transformed with pMoPac2GS18 (VNP/GS18).
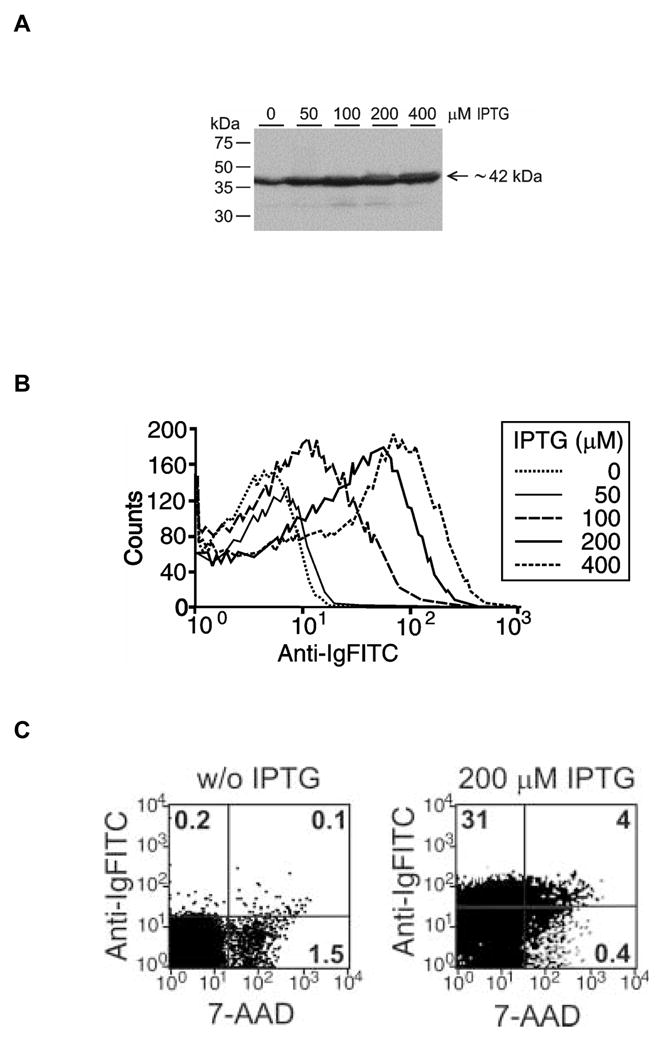
(A) Western blot analysis of Lpp-OmpA-scFv levels in whole cell lysates after induction with different IPTG concentrations. The expected 42 kDa fusion protein is identified using anti-Ig antibody as described in Materials and Methods. (B) Flow cytometric analysis of the surface expression of anti-CEA scFv using anti-Ig FITC after induction with increasing doses of IPTG. (C) Uninduced and induced (IND) cells double stained with anti-Ig FITC and 7-AAD. Data are representative of one of two (Western blot) or four (flow cytometry) experiments performed. Numbers in quadrants show percentage of the total population of cells stained with indicated reagents.