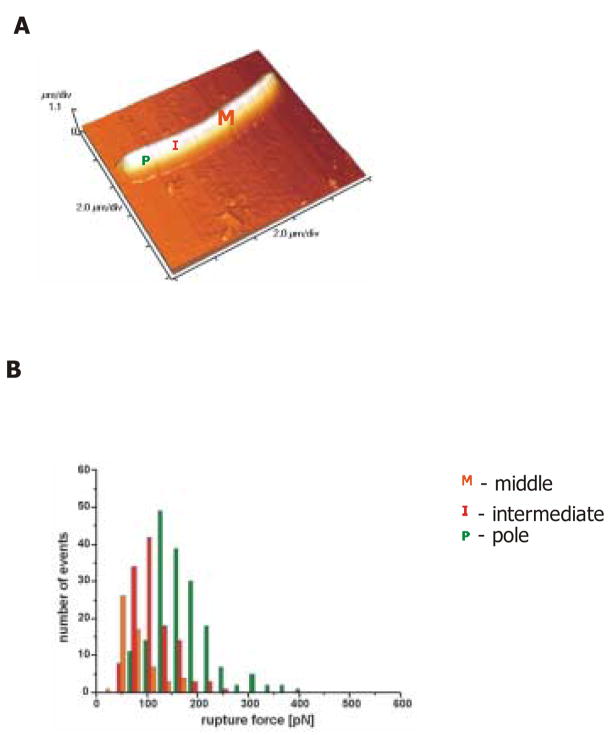
Figure 4. The pattern of anti-CEA-scFv expression in VNP/GS18IND as probed with atomic force microscopy.
(A) The image of a single bacteria in AFM with descrete regions denoted as P (pole), I (intermediate region) and M (middle region). (B) Histogram (obtained from 400 force curves) of rupture forces recorded with a CEA-coated tip. Green bars represent rupture forces for a pole (P) region, orange bars – (I) and red bars – (M). The force-distance relationships have a slightly non-linear character due to polymer extension. Data represent a single measurement performed on at least two bacterial cells representative of two independent experiments.

