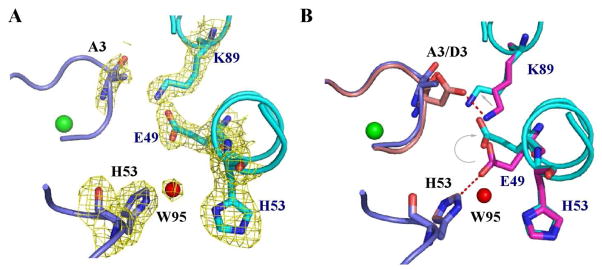
Figure 4.

Salt bridge changes in the D3A-NiSOD mutant. A. The D3A-NiSOD mutant is shown at the interface between neighboring monomers (in blue and cyan) in the hexamer. A weighted 2Fo-Fc map shows the electron density in the interface. B. Superposition of this interface from D3A-NiSOD (in blue and cyan) onto wild type (pink and magenta) shows the movement of Glu49 and Lys89. Images were generated in PyMOL (75).
