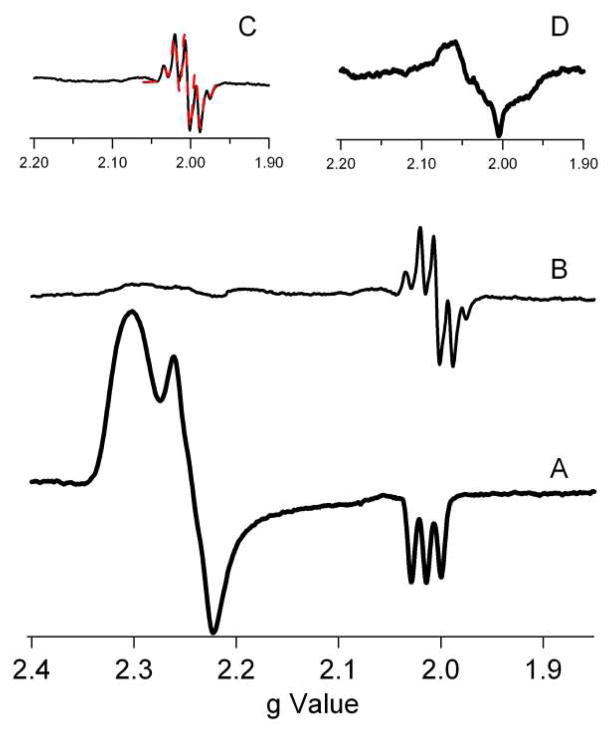
Figure 7.
X-band EPR data from D3A-NiSOD. (A) As-isolated D3A. (B) H2O2 treated D3A. (C) Enlargement of the region near g = 2.00 expanded (solid line) and a simulation with parameters gx=gy=gz=2.004, Axx=Ayy=5 G, Azz=20 G (dashed line-red). (D) H2O2 treated D3A-NiSOD (d4-Tyr), showing alteration of hyperfine due to tyrosine ring protons. All spectra are shown with the same intensity scale with the exception of D, which has a scale half as large.

