
Figure 1.
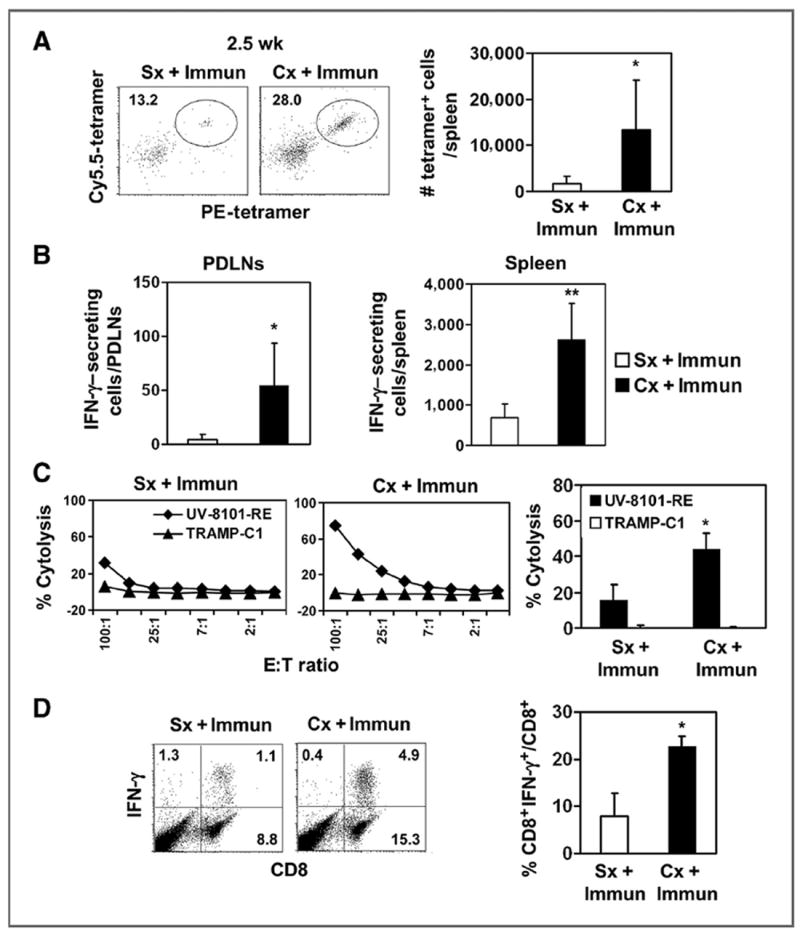
Enhanced antigen-specific effector responses 2.5 weeks after castration and immunization. A, splenocytes were stained with CD8, CD44, PE-tetramer, and Cy5.5-tetramer. Cells enriched with anti-PE beads were analyzed. The representative dot plot (left) shows PE- and Cy5.5-tetramer double-positive cells gated on the CD8+CD44+ population. The number of tetramer-positive cells was quantified (bar graphs; ■, Cx + Immun; □, Sx + Immun). The experiment was repeated once. B, IFN-γ–secreting cells in response to ex vivo UV-8101-RE stimulation were identified using ELISPOT assay with PDLNs (left) and spleen cells (right) from both groups. The average of triplicate wells in 1 representative experiment is shown. C, lytic capacity of MLTC cells, 2.5 weeks after immunization, was determined in a 51Cr release assay. Targets are UV-8101-RE (◆) and TRAMP-C1 (▲). Line graphs show one representative animal from each group and bar graphs show the average of all animals in each group at an effector:target (E:T) ratio of 50:1. D, effector cytokine production was determined by intracellular cytokine staining of MLTC cells. Flow diagram (left) shows representative samples of CD8+ cells that express IFN-γ after ex vivo restimulation. The percentage of CD8+ T cells that express IFN-γ was calculated (right). Data are mean values ± SD. *, P < 0.05; **, P < 0.01 for Sx + immunization (Immun) versus Cx + immunization. One representative experiment with 3 to 5 animals per group is shown. Each experiment was repeated at least once. Cx, castration; Sx, sham treatment.