Figure 6.

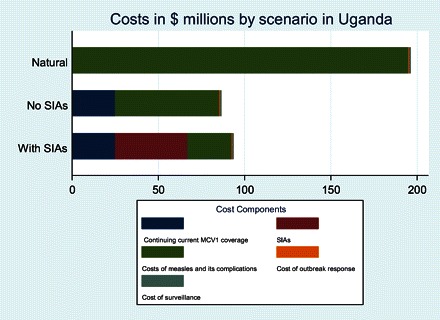
Cost structure between measles control scenarios in Uganda. Costs are cumulative discounted costs from 2010 to 2050, calculated as the average of 100 iterations of each scenario. SIA, supplemental immunization activity.

Cost structure between measles control scenarios in Uganda. Costs are cumulative discounted costs from 2010 to 2050, calculated as the average of 100 iterations of each scenario. SIA, supplemental immunization activity.