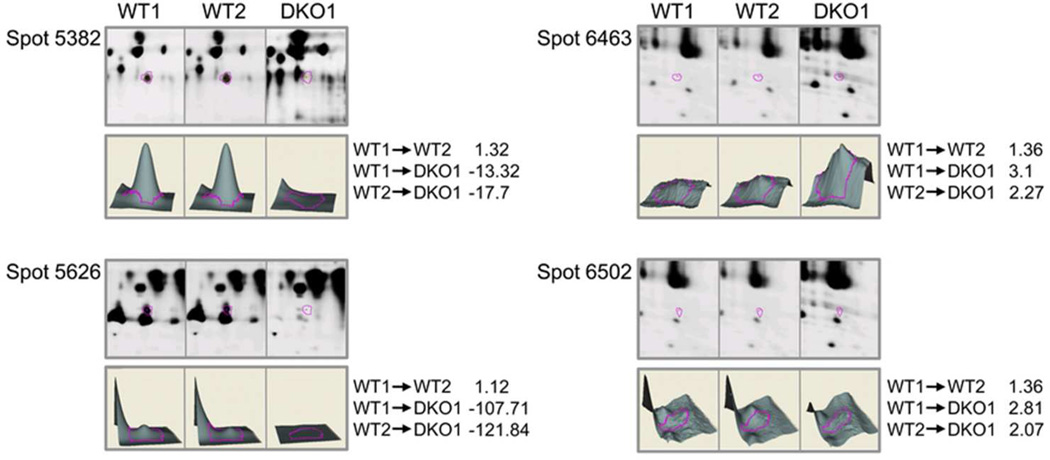
Figure 2.
(A) Quantitative analysis of changes in abundance of postnatal 2-day-old lens protein spots in WT and DKO lenses by mass spectrometry. The 3D data sets for representative proteins in two WT (WT1 and WT2) and one DKO (DKO1) sample are shown. DKO1 proteins were labeled with Cy2, WT1 proteins with Cy3, and WT2 proteins with Cy5 dyes. Fold changes between each sample are indicated on the right. See Table 1 for the identity of proteins present in each protein spot.

