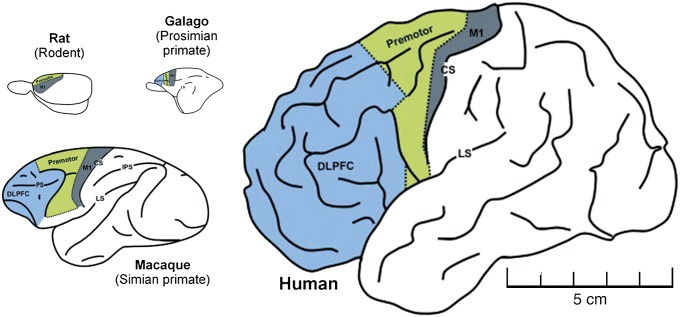
Fig. 3.
Schematic showing relative size of frontal lobe across different species and the potential capacity for anterior–posterior information flow. The blue areas represent the prefrontal cortex, and the schematic shows how the prefrontal cortex proportionally increases in size with increasing brain size across species. Relative brain size is scaled to the human brain. Modified from (102) with permission from Elsevier.

