
Figure 2.
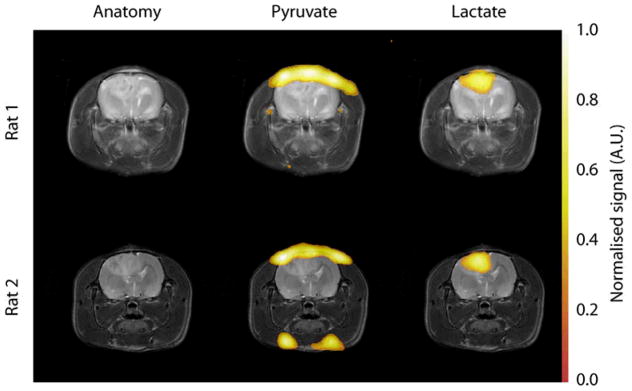
Images showing hyperpolarized 13C CSI of pyruvate and lactate within two C6 glioma bearing animals. The grayscale images are T2-weighted RARE images showing the tumor and associated edema. The color images are the 13C CSI data, superimposed upon the proton images for anatomical reference. The pyruvate signal is localized to the blood vessels at the top of the brain and also, occasionally, at the base of the head. The lactate signal is localized to the tumor mass. The lactate signals have been normalized to the maximum pyruvate signal in each dataset. This distribution of labeled pyruvate and lactate was observed in all animals.