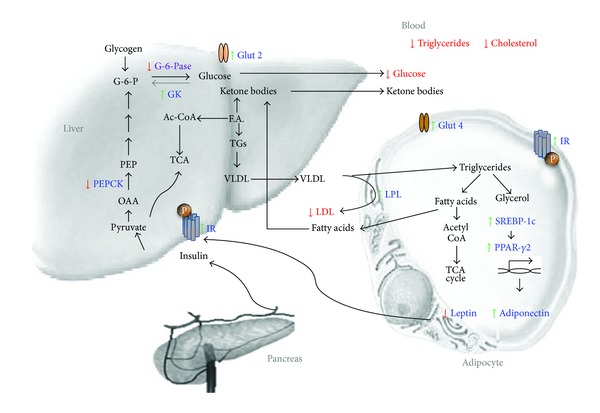
Figure 10.

Schematic representation of swertiamarin in amelioration of insulin resistance and TIIDM. Figure shows carbohydrate and fat metabolic pathways and candidate genes which are altered during diabetes. Swertiamarin treatment modulates not only the expression of these target genes which is marked in blue but also the metabolite levels in blood marked in red.
