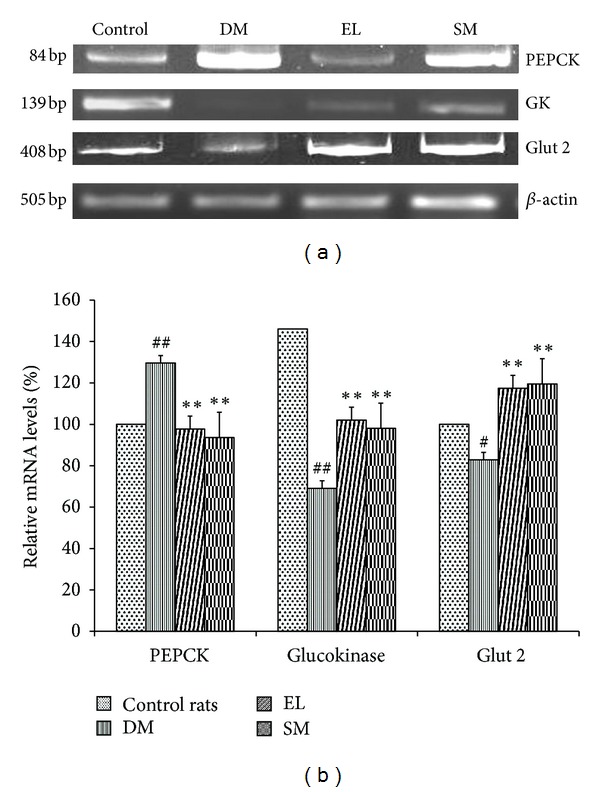
Figure 5.

(a) Effect of EL extract and SM treatments on the mRNA expression of PEPCK, GK, Glut 2, and β-actin in the hepatic tissue as compared to diabetic rats (Gel image). (b) Effect of EL extract and SM treatments on the expression of PEPCK, GK, and Glut 2 in the hepatic tissue as compared to diabetic rats. The expression levels were checked using semi-quantitative RT-PCR and densitometric analysis. Data presented as mean ± SEM of 4 independent observations. ## P < 0.05 versus control rats; **P < 0.05 versus diabetic rats.
