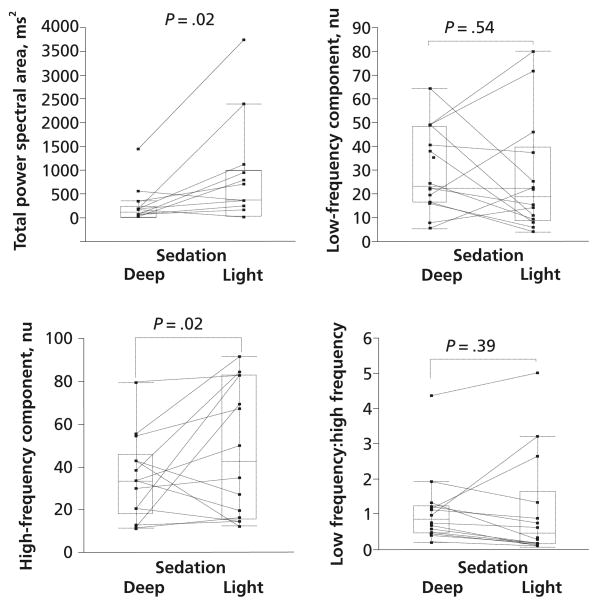
Figure 2.
Total power spectral area, low-frequency component expressed in normalized units (nu), high-frequency component expressed in nu, and low frequency:high frequency ratio between deep and light sedation. The horizontal lines inside the boxes represent the medians. The boxes encompass the 25th through the 75th percentile, and the error bars indicate the outermost data points other than outliers.

