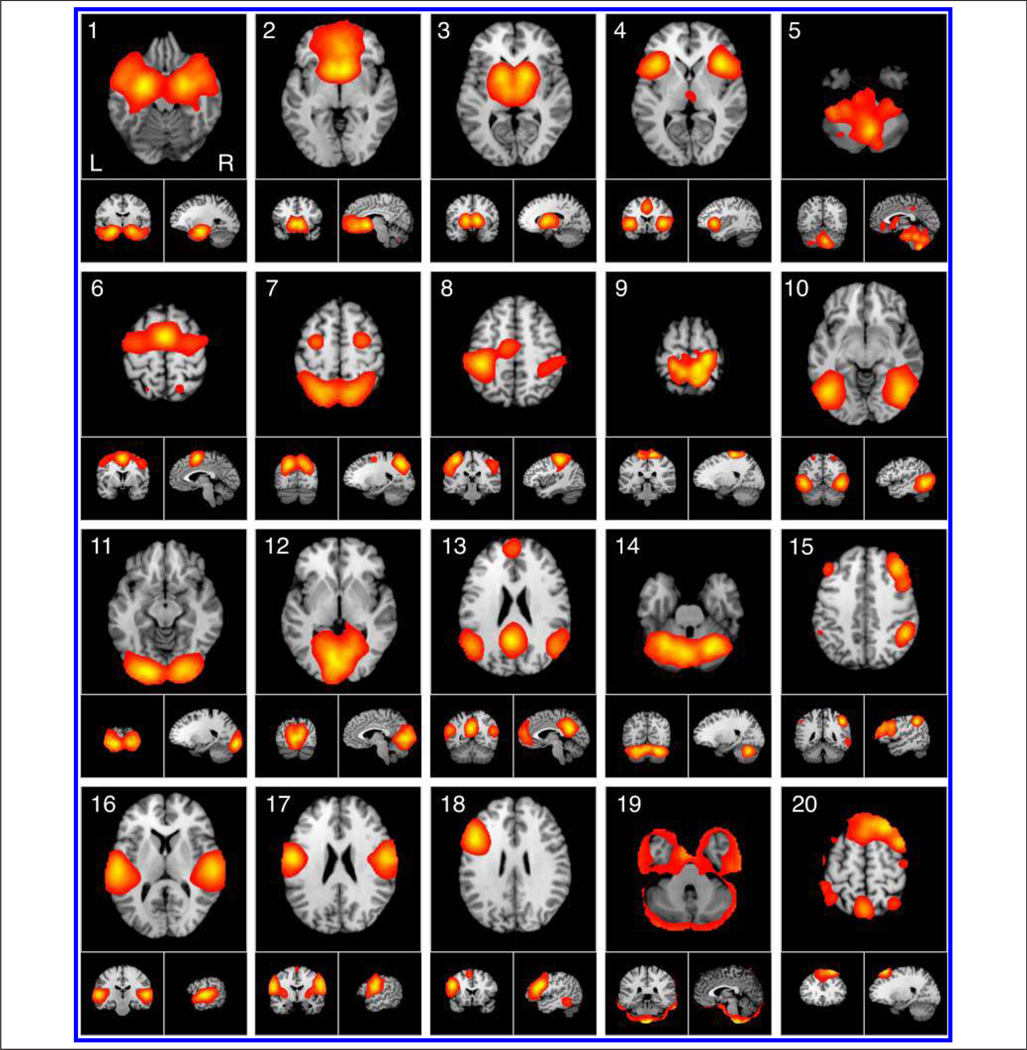
Figure 2.
ICA was used to decompose 8637 experiment images extracted from the BrainMap database into 20 spatially co-occurring maps of ICNs. ICA maps were converted to z statistic images via a normalized mixture model fit, thresholded at z > 4, and viewed in standard (Talairach) brain space. Orthogonal slices of the most representative point in space are shown.

