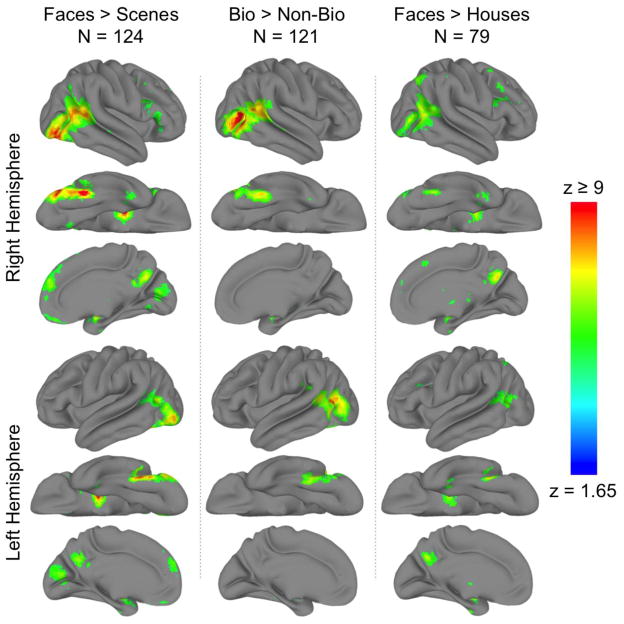
Figure 1. Group GLM contrast maps.
Significantly activated voxels q(FDR) < .001) from the (column 1) faces > scenes, (column 2) biological > non-biological motion, and (column 3) faces > houses contrasts displayed on the cortical surface of a ‘standard’ brain. Displayed are the lateral, ventral, and medial views of the (rows 1–3) right and (rows 4–6) left hemisphere.

