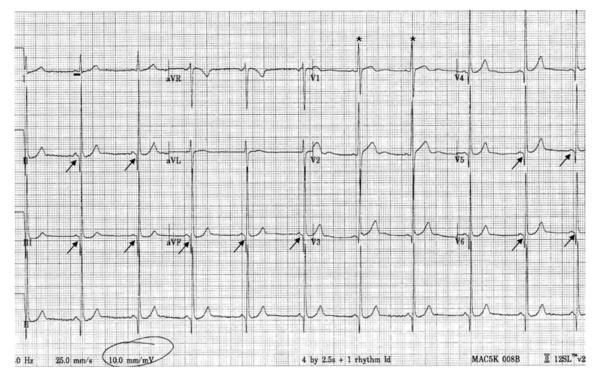
Figure 3.
Electrocardiogram of a patient with Becker muscular dystrophy. Note the short PR interval (98 ms, black horizontal bar, normal range: 120–200 ms), Q waves in leads 2, 3, aVF, V5, V6 (arrows), and tall R wave in V1 (asterisks). The EKG finding in patients with Duchenne muscular dystrophy is similar.

