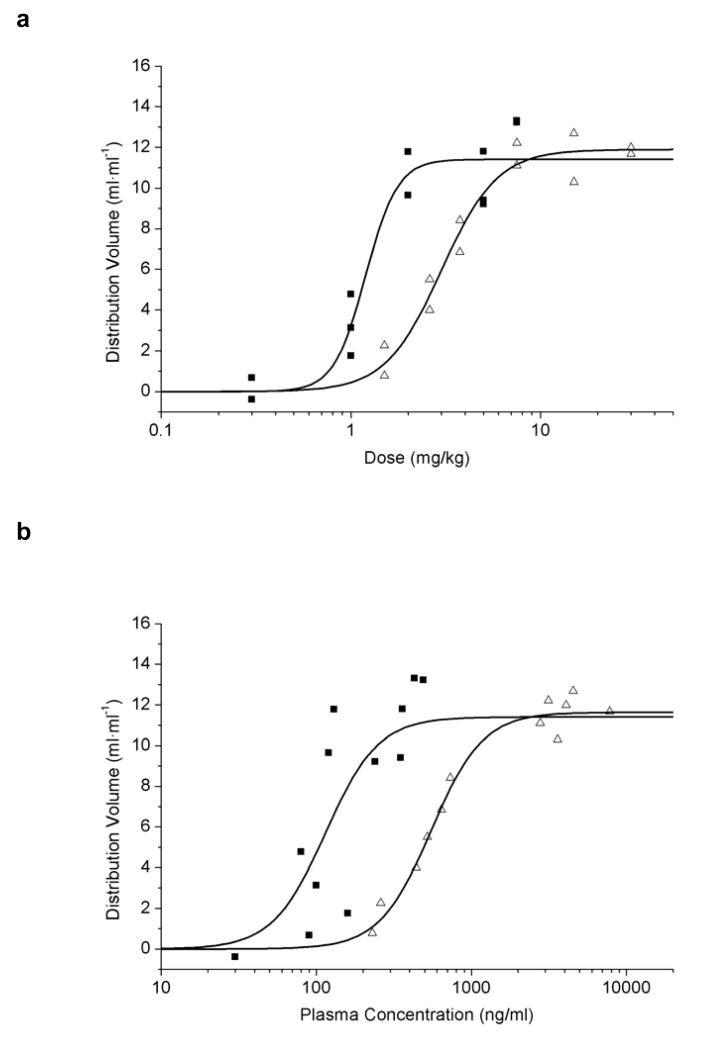
Fig. 2.
DVs of VPM in whole brain after administration of tariquidar (open triangles) or elacridar (filled squares) plotted against inhibitor dose (mg/kg) (a) or inhibitor plasma concentration (ng/ml) (b). Note that x-axes are in a logarithmic scale. Plasma concentrations were determined in arterial blood samples collected at the end of the PET scan (i.e. at 180 min after inhibitor administration) by LC/MS analysis. Sigmoidal Hill curves were fitted to the data and gave estimated ED50 values of 3.0±0.2 and 1.2±0.1 mg/kg and EC50 values of 545.0±29.9 and 114.5±22.2 ng/ml for tariquidar and elacridar, respectively

