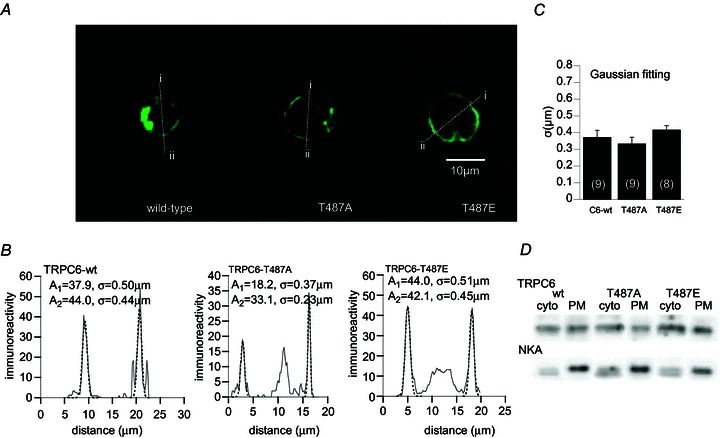
Figure 6. Immunocytochemical staining of wt-TRPC6 and Thr487 mutants expressed in HEK cells.

A, typical immunostained images of three heterologously expressed TRP channels (wild-type, T487A, T487E). Both mutants show a clear membrane-targeted expression profile similar to wt-TRPC6. B, distribution of immunofluorescence across the cell for the three TRP channels which was measured along the lines i–ii in A. Dotted curves are the results of the Gaussian fitting of each peak with the relationship: A× exp(–(x–m)2/(2σ2), where A, x, m and σ denote the peak intensity of immunofluorescence, distance (μm), position of the peak (μm), and standard deviation of the peak distribution (μm), respectively. C, comparison of immunofluorescence distribution pattern (σ values) among the three channels. D, immunoblots of wild-type (wt) and Thr487 mutant (T487A, T487E) TRPC6 proteins in the plasma membrane (PM) and cytosolic (cyto) fractions. Na+/K+-ATPase (NKA) was used as a PM marker. Representative of 3 experiments.
