
Figure 3. Plasma HMB (A), Leu (B) and insulin (C) in response to oral HMB (open circle) or Leu (filled circle) consumption.
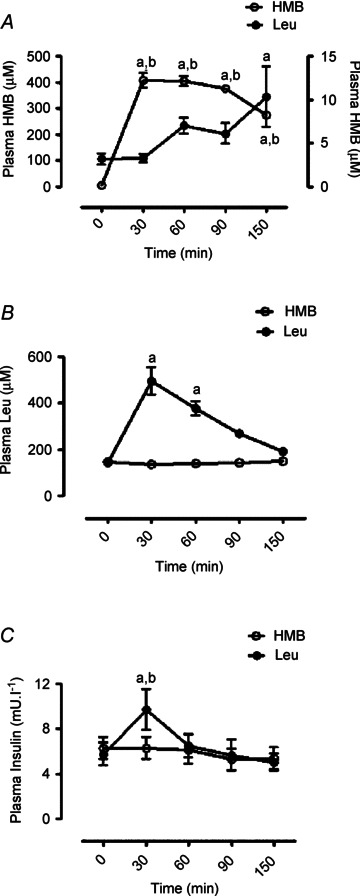
Left y-axis represents scale for HMB group, right y-axis represents scale for Leu group. Letters indicate statistical significance (P < 0.05): a = different from respective basal; b = different between groups at equivalent time-point. Data are presented as means ± SEM.