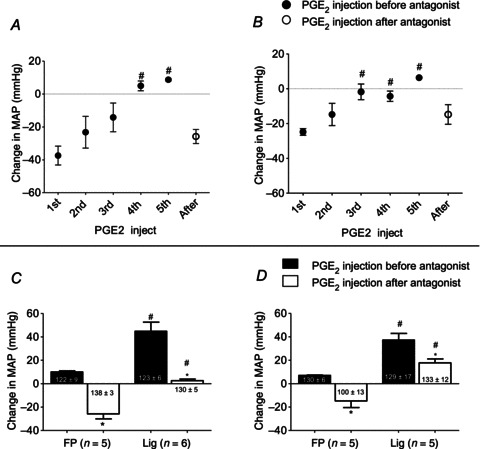
Figure 1. Effects of EP3 and EP4 antagonists on the pressor responses to femoral arterial injection of PGE2 (10–20 μg).

A, changes in MAP for five sequential injections of PGE2, after which the EP3 antagonist, L798106 (1 μg), was injected into the femoral artery of five rats with FP femoral arteries. B, changes in MAP for five sequential injections of PGE2, after which the EP4 antagonist, L161982 (1 μg), was injected into the femoral artery of five rats with FP femoral arteries. A and B, number sign (#) signifies that the pressor response was significantly greater (P < 0.05) than the depressor response to the first injection. C, summary data for effect of the EP3 antagonist on the pressor responses to PGE2 injection in five rats with patent femoral arteries and in five rats with Lig arteries before (filled bars) and after (open bars) injection of the EP3 antagonist. Note that the pressor responses to PGE2 in the FP rats represent that of the fifth sequential injection of the prostanoid shown in (A), whereas the pressor responses in the ‘Lig’ rats represents that of the first injection of PGE2. D, summary data for effect of the EP4 antagonist on the pressor responses to PGE2 injection in five rats with patent femoral arteries and six rats with Lig arteries before (filled bars) and after (open bars) injection of the EP4 antagonist. Note that the pressor responses to PGE2 in the FP rats represents that of the fifth sequential injection of the prostanoid shown in (A), whereas the pressor responses in the Lig rats represents that of the first injection of PGE2. In (C) and (D) and in subsequent figures, numbers within or underneath the vertical bars represent baseline means ±s.e. C and D, number sign (#) signifies a significant difference (P < 0.05) between the pressor response to PGE2 injection in the Lig rats and that to injection in their FP counterparts. Asterisk (*) signifies a significant difference (P < 0.05) within either the ‘Lig’ or ‘freely perfused’ rats between changes in MAP before and after the EP antagonist. EP, endoperoxide; FP, freely perfused; Lig, ligated; MAP, mean arterial pressure.
