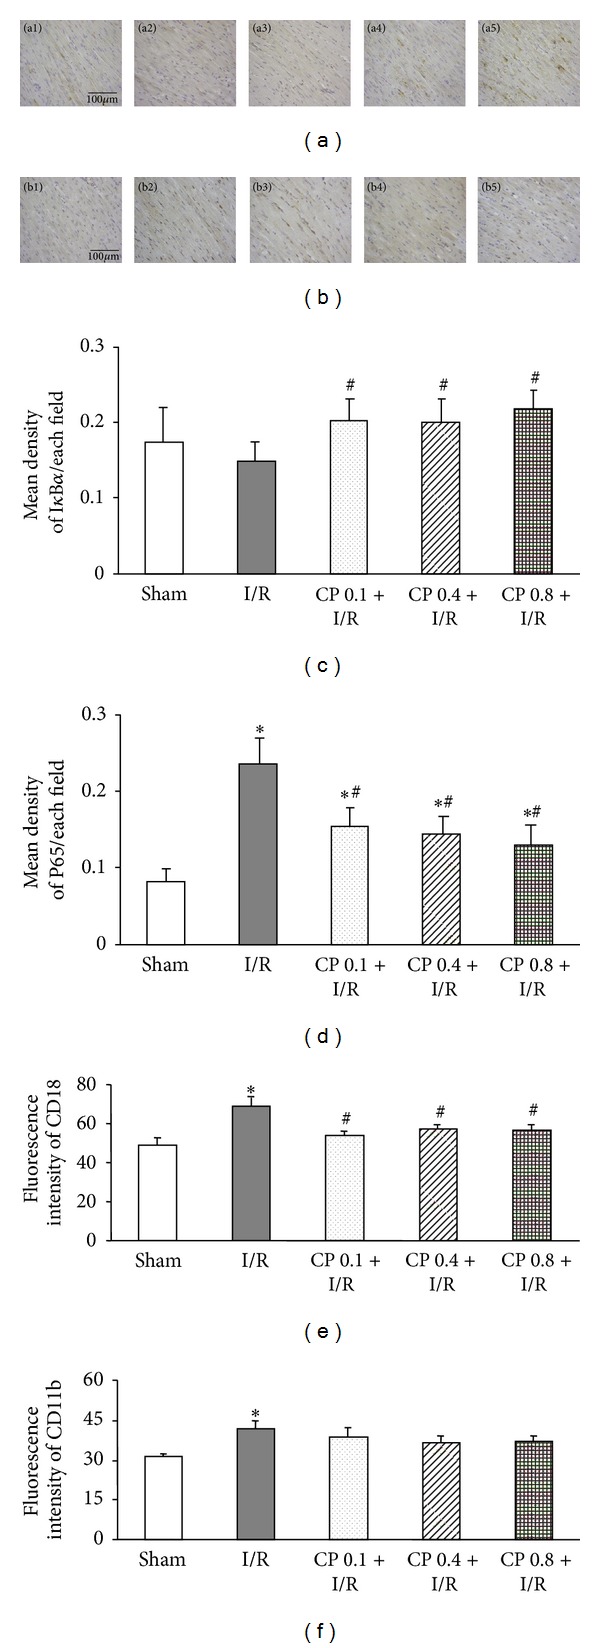
Figure 8.

Effects of CP pretreatment on NF-κB activation and adhesion molecule expression after I/R. (a) Representative images of immunohistochemistry staining for IκBα. IκBα positive cells are revealed by DAB (brown). Bar = 100 μm. (b) Representative photographs of myocardial sections stained for P65 in different groups. P65 proteins are shown in brown color. Bar = 100 μm. (c) Statistical results of IκBα expression in five groups. (d) Quantitative analysis of P65 expression in various groups. 1, 2, 3, 4, and 5 denote Sham, I/R, CP 0.1 + I/R, CP 0.4 + I/R, and CP 0.8 + I/R group, respectively. (e) and (f) The expression of adhesion molecules CD18 and CD11b on rat neutrophils, respectively. The expression of adhesion molecules is presented as fluorescence intensity of FITC. Results are presented as mean ± SEM (n = 6). *P < 0.05 versus Sham group, # P < 0.05 versus I/R group.
