
Figure 9.
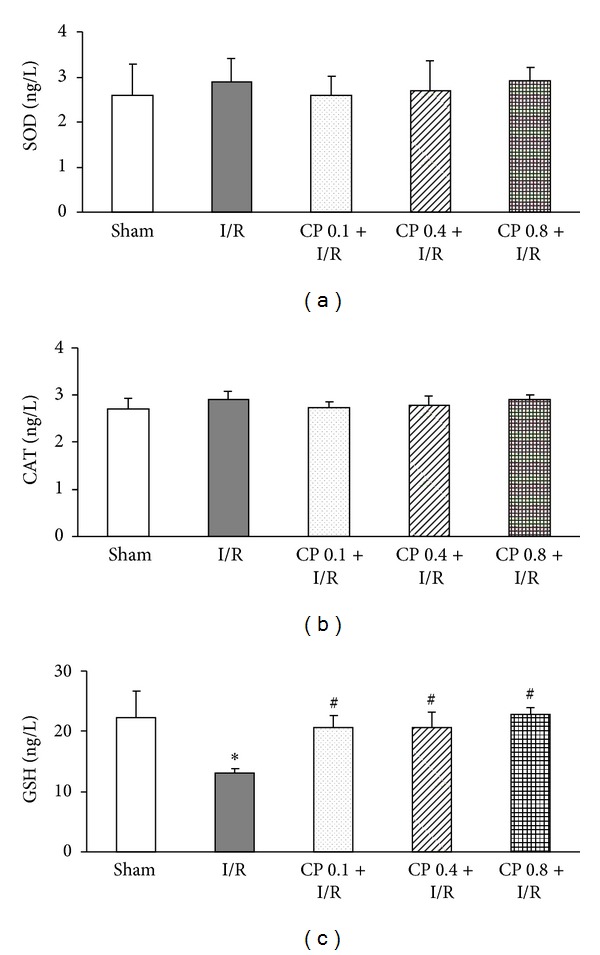
The effect of CP pretreatment on the expression of antioxidative enzymes after I/R. (a) Myocardial SOD expression in different groups. (b) The level of myocardial CAT in various groups. (c) GSH expression of myocardial tissues in five groups. Data are presented as mean ± SEM (n = 6). *P < 0.05 versus Sham group, # P < 0.05 versus I/R group.