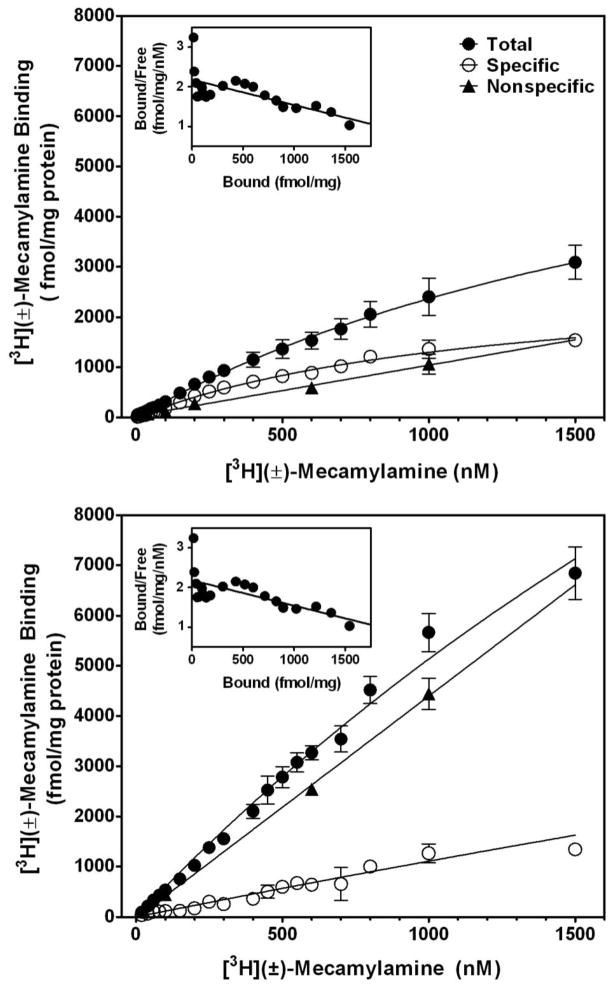
Fig. 4. Saturation analysis of racemic [3H]mecamylamine binding to rat brain membranes in the absence (top) and presence of 1 mM S(−)nicotine (bottom).
Saturation analysis was determined using a concentration range of 20–1500 nM of racemic [3H]-mecamylamine in both the absence (top) and presence of nicotine (1 mM; bottom). Nonspecific binding was measured with 100 μM (±)-mecamylamine. Data are expressed as fmol/mg protein and represent the mean ± S.E.M. of three independent experiments. Curves were generated using nonlinear regression for a one-site model. The inset illustrates the Scatchard transformation of the specific binding data.

