
Fig. 1.
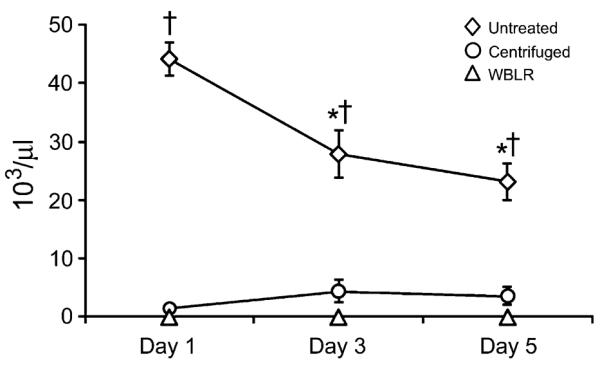
Change in platelet concentration over the 5-day storage period in untreated (n = 10), centrifuged (n = 10), and leucoreduced whole blood (WBLR) (n = 28) plasma samples. The y-axis represents platelet count in ×103/μl. *Decreased from day 1 of storage. †Increased over centrifugation and WBLR samples (P < 0.05).