
Fig. 4.
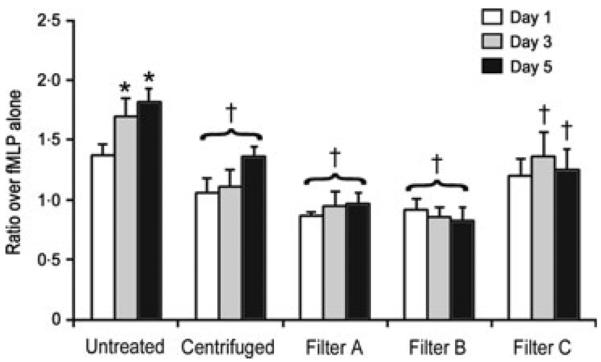
PMN priming activity represented as fold over negative control (PMNs incubated with buffer and LPS only) expressed as the mean ± SEM. *Greater than day 1 of same preparation. †Lower than untreated plasma on equivalent storage day (P < 0.01).
Official websites use .gov
A
.gov website belongs to an official
government organization in the United States.
Secure .gov websites use HTTPS
A lock (
) or https:// means you've safely
connected to the .gov website. Share sensitive
information only on official, secure websites.
PMN priming activity represented as fold over negative control (PMNs incubated with buffer and LPS only) expressed as the mean ± SEM. *Greater than day 1 of same preparation. †Lower than untreated plasma on equivalent storage day (P < 0.01).