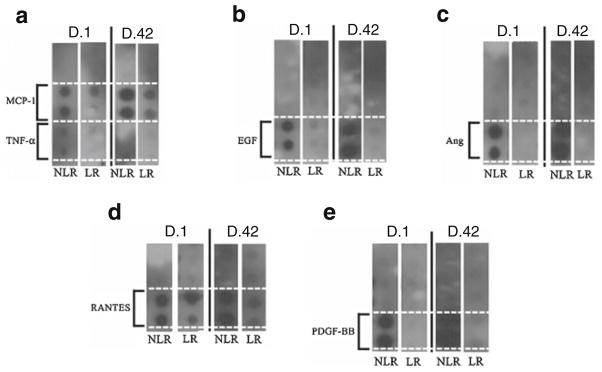
Fig. 1.

Screening ChemiArray analysis from the day 1 (D.1) and day 42 (D.42), leukoreduced (LR) or nonleukoreduced (NLR), plasma fraction of stored pRBCs. Each dot in duplicate represents detection of a specific cytokine or growth factor. a Columns from ChemiArray analysis from D.1 and D.42, NLR and LR, blood showing increased expression of MCP-1 and TNF-α in duplicate. Solid black line separates two trials. The same experiments run with ChemiArray show elevated expression of EGF (b), angiogenin (Ang, c), RANTES (d), and PDGF-BB (e)
