Figure 2.

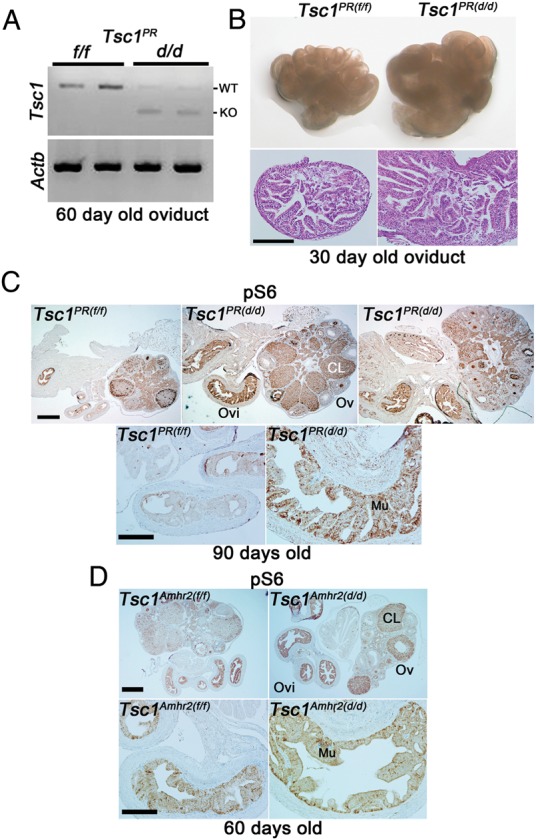
Tsc1PR(d/d) oviducts exhibit higher epithelial hyperplasia and increased mTORC1 signaling. (A) RT–PCR showing inactivation of Tsc1 in Tsc1PR(d/d) oviducts compared with Tsc1PR(f/f) oviducts from mice at 60 days of age. Actb (encoding β-actin) served as a loading control. (B) Morphology and histology of oviduct and ovary of Tsc1PR(f/f) and Tsc1PR(d/d) from mice 6–8 weeks of age showing an increased oviductal size and epithelial hyperplasia in Tsc1PR(d/d) oviducts. Seven Tsc1PR(f/f) and nine Tsc1PR(d/d) females were assessed for oviductal and ovarian morphology, while one Tsc1PR(f/f) and three Tsc1PR(d/d) oviducts were assessed for histology. Bar, 100 µm. (C and D) Immunostaining for pS6 in oviducts and ovaries of Tsc1PR(f/f)(n = 3), Tsc1PR(d/d) (n = 3), Tsc1Amhr2(f/f) (n = 4), or Tsc1Amhr2(d/d) (n = 4) females indicated increased mTORC1 signaling primarily in Tsc1PR(d/d) oviductal mucosa (Mu). Ovaries and oviducts from Tsc1Amhr2(f/f) or Tsc1Amhr2(d/d) females were collected at 60 days (n = 2) or 90 days of age (n = 2). The intensity of staining was similar between these two groups. Top panels show lower magnification: bars, 400 µm; bottom panels show higher magnification: bars, 100 µm. WT; wild-type, KO; knockout, Ovi, oviduct; Ov, ovary; CL, corpus luteum.
