
Figure 5. The effects of inhibition on coincidence detection.
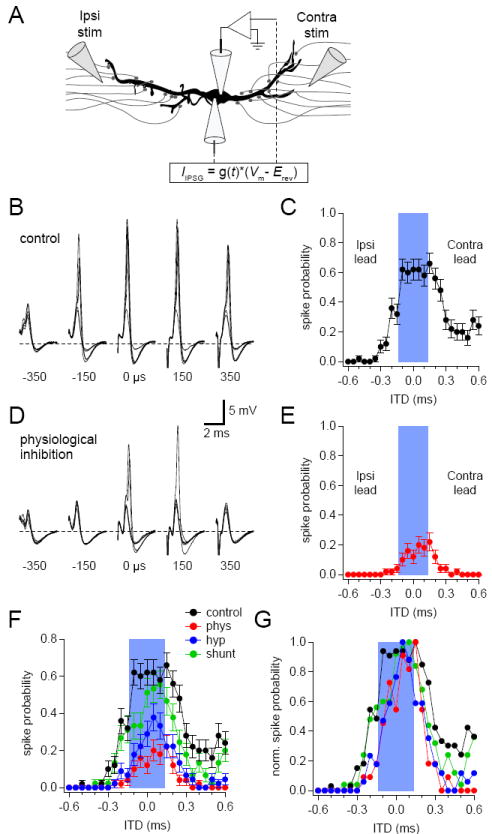
(A) The two electrode dynamic clamp recording configuration used for coincidence detection experiments. Ipsilateral and contralateral stimulating electrodes activated excitatory afferents at time intervals covering ± 0.6 ms while the dynamic clamp was used to simulate inhibitory conductances starting 0.3 ms before the onset of contralateral EPSPs. (B, D) Sample data from a representative cell showing overlays of 5 of 55 coincidence trials at each ITD value shown in (D) in the absence (B) or presence (D) of preceding physiological inhibition. (C, E) ITD spike probability functions in the absence (C) or presence (D) of physiological inhibition were constructed by determining the portion of trials at each ITD value that yielded an action potential. (F, G) Summary plots showing the results of ITD trials in the absence or presence of physiological, shunting, or hyperpolarizing inhibition from the cell shown in (B-E). Plots in (G) are normalized to highlight effects of inhibition on ITD function shape. Blue bars in (C, E, F, G) indicate the physiological range (± 135 μs) for ITD detection. Error bars show SEM. See also Figures S1, S2, and S3.