
Figure 7. Temporal summation of IPSPs during high frequency trains.
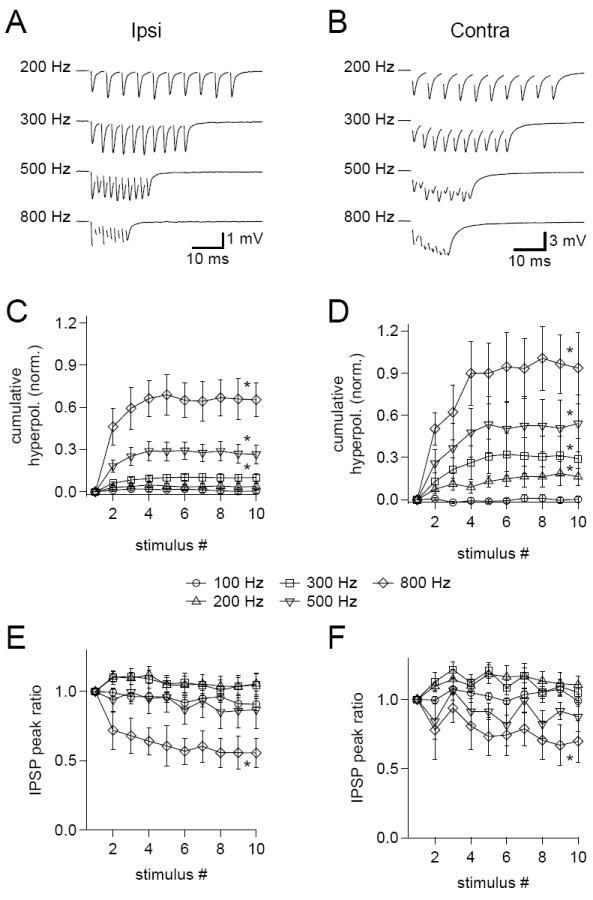
(A,B) Sample data showing trains of IPSPs evoked by ipsilateral (A) and contralateral (B) stimuli at the indicated frequencies. Data are from the same cell and are averages of 50 trials. Stimulus artifacts have been removed. (C,D) Hyperpolarization of the membrane potential relative to rest at the onset of each IPSP in ipsilateral (C) and contralateral (D) trains increased with increasing stimulus frequency. Data are normalized to the peak amplitude of the first IPSP in the train. (E,F) The ratios of the peak amplitudes of each IPSP in ipsilateral (E) and contralateral (F) trains to the amplitude of the first IPSP in a train show that there was no significant short term depression until the train frequency was > 500 Hz. Error bars show SEM. Ipsilateral n=9, contralateral n=7, with ipsilateral and contralateral IPSPs evoked together in 5 cells. Data from P25-32 gerbils. * p < 0.05 for one-tailed paired t-test comparing the mean of the final three events in a train to the first event.