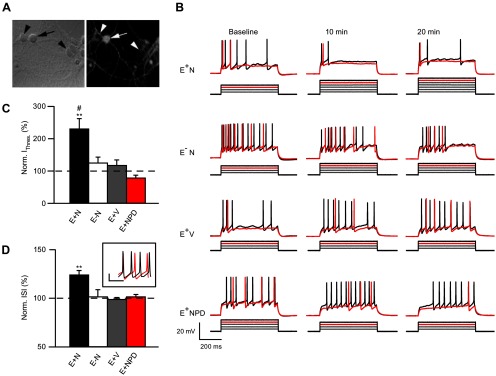
Figure 1.
NRG1 decreases ErbB4+ neuron excitability. A, Neurons live-labeled with mAb77 viewed in the recording chamber using phase contrast (left) or fluorescent (right) microscopy; ErbB4+ (arrow) and ErbB4− (arrowhead) neurons are marked (magnification 63×). B, Representative traces of current injection steps, showing the rheobase current (red) and one subsequent trace (black). Below each trace is the accompanying current injection protocol (50 pA steps, not to scale). C, Summary graph of normalized current threshold to evoke an AP at 20 min (E+N, n = 9; E−N, n = 5; E+V, n = 6; E+NPD, n = 6); **p < 0.005 comparing E+N to E+V and E+NPD; #p < 0.05 comparing E+N to E−N. D, Summary graph of normalized ISI at 20 min averaged over all current injections (E+N, n = 5; E−N, n = 3; E+V, n = 3; E+NPD, n = 4); **p < 0.005 comparing E+N to E−N, E+V, and E+NPD. Inset shows example of ErbB4+ cell firing at baseline (black) and 20 min (red) after NRG1 application at 700 pA injection. Calibration: 20 mV, 10 s.

