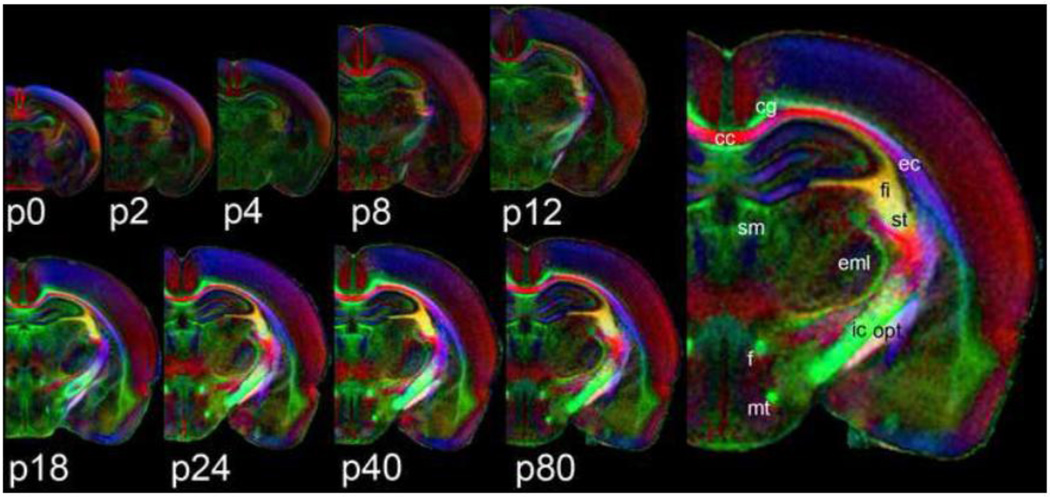
Figure 1.
Population averaged, coronal, color FA maps from nine different postnatal time points (p0–p80). Slices are taken from approximately the same location—the rostral aspect of the hippocampal formation. The p80 image is replicated and enlarged (right) to show detail. Several major white matter structures are labeled using the nomenclature and abbreviations of the Paxinos and Watson rat brain atlas (2008); cc – corpus callosum; cg – cingulum; ec – external capsule; eml – external medullary lamina; f – fornix; fi – fimbria; ic – internal capsule; mt – mamillothalamic tract; opt – optic tract; sm – stria medullaris; st – stria terminalis.

