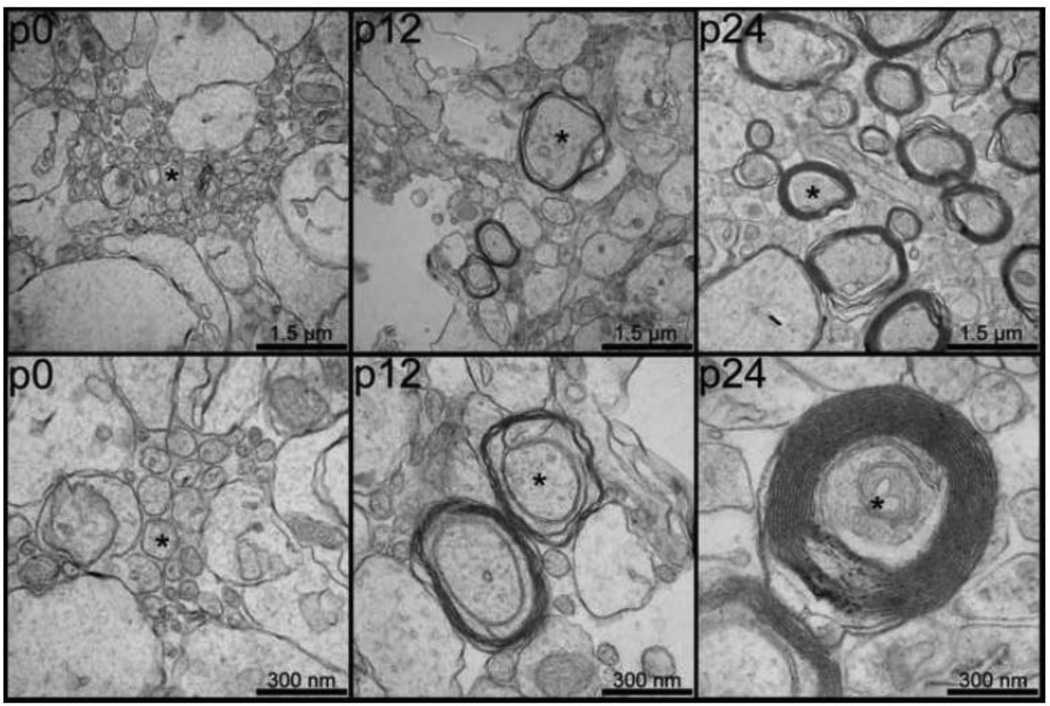
Figure 7.
Electron micrographs of the genu of the corpus callosum at three postnatal time points (p0, left; p12, center; and p24, right) demonstrating postnatal cerebral myelination. Both low power (50,000× magnification, top) and high-power (100,000× magnification, bottom) are shown for each time point. Representative axons are marked with asterisks and scale bars are shown in the bottom right corner of each image.

