Figure 2.
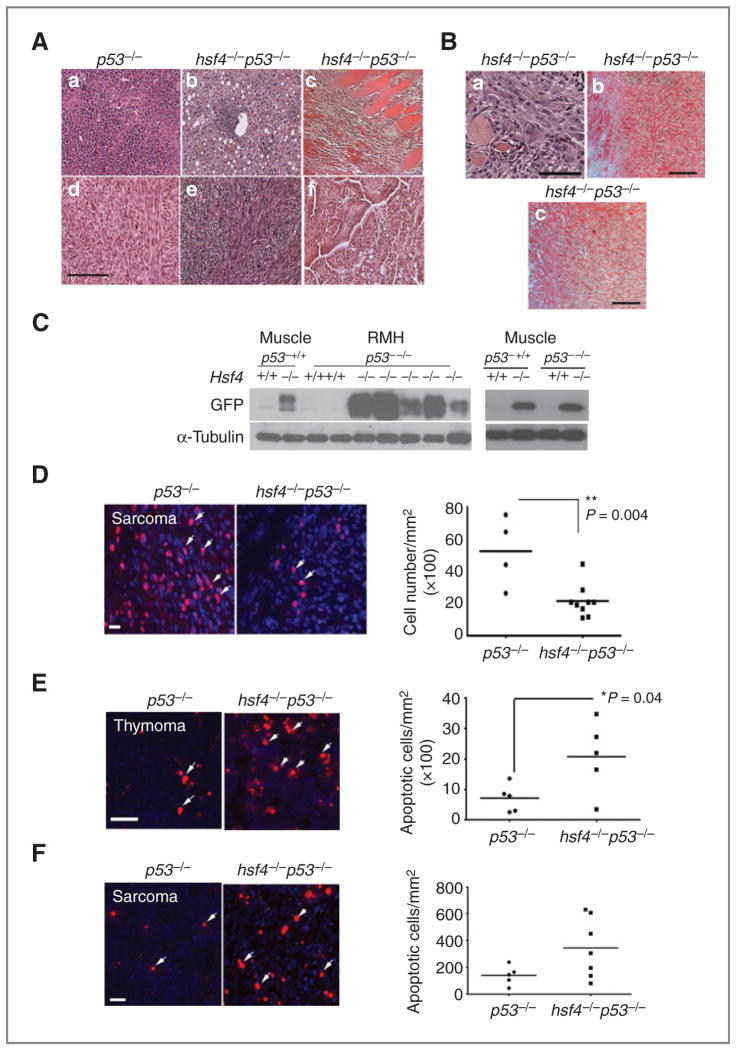
hsf4−/−p53−/− sarcomas exhibit lower proliferative potential. A, histopathologic analyses (H&E staining) of representative tumors from the p53−/− (a, d) and hsf4−/−p53−/− (b, c, e, f) mice. (a) lymphoma, (b) HCC, (c) RMH, (d) sarcoma, (e) sarcoma, (f) lung carcinoma. Bar = 100 μm. B, characterization of RMH tumors from hsf4−/−p53−/− mice using immunohistochemical staining; (a) H&E, (b) desmin, and (c) myogenin. Bar = 100 μm. C, immunoblot analyses showing the expression of hsf4-GFP in normal muscle tissue and RMH from hsf4−/−p53−/− mice (left). Cell lysates from p53−/− tumors were used as negative control. α-Tubulin served as loading control. Right panel shows GFP expression in the normal adult muscle in the indicated genotypes. D, Ki67 immunostaining of sarcomas derived in p53−/− (n = 4) versus hsf4−/−p53−/− mice (n = 9). Ki67-positive cells were quantitated per mm2 of tissue section (right). Bars represent mean ± SD. P values were calculated using 2-tailed Student t test. Arrows show Ki67-positive cells. Bar = 10 μm. E and F, TUNEL-positive cells in representative thymoma and sarcoma derived in p53−/− or hsf4−/−p53−/− mice (n = 5–7 per group). TUNEL-positive cells were quantitated per mm2 of tissue sections (right). Bars represent mean ± SD. P values were calculated using 2-tailed Student t test. Arrows show some of the TUNEL-positive cells. Bar = 100 μm.

